
2026 Project Management Software Market Report: Adoption & Preferences
Project management software entered 2026 as a core operating layer for distributed teams, PMOs, service businesses, construction firms, technology companies, and transformation programs. Buyers now expect more than task management: they want resource visibility, portfolio control, secure automation, and decision-ready analytics. This report examines market growth, adoption gaps, AI demand, security expectations, deployment preferences, buyer behavior, and the practical criteria organizations should use when selecting their 2026 project-management platform.
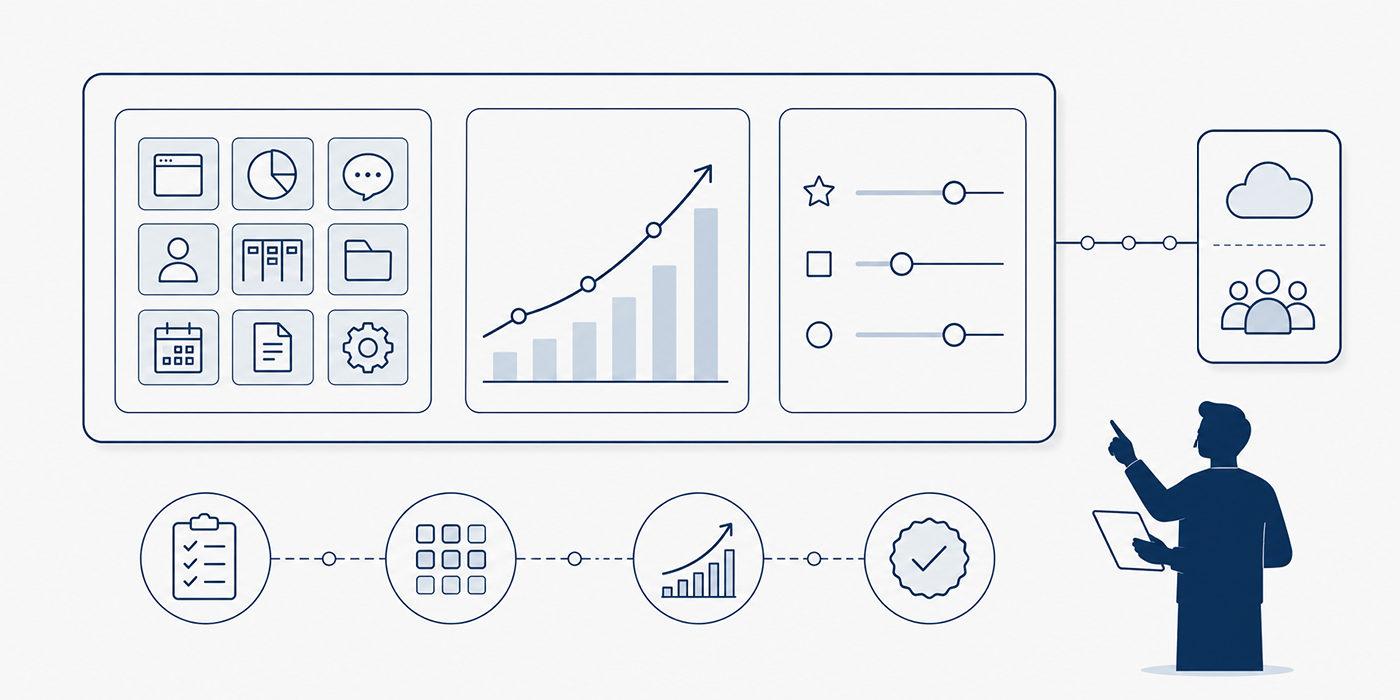
1. Executive Summary: The Project Management Software Market in 2026
Published market estimates place the global project management software sector between $8.7 billion and $11.27 billion in 2026. Grand View Research estimates an $8.7 billion market, The Business Research Company projects $10.51 billion, and Mordor Intelligence estimates $11.27 billion. Their forecasts also indicate double-digit expansion, although their category definitions, included services, geographic models, and vendor classifications differ.
The useful conclusion for buyers and vendors is the direction rather than a single headline figure. Demand is expanding because organizations need stronger project scheduling, workflow automation, resource planning, cross-team reporting, and governance across increasingly complex portfolios.
Grand View Research forecasts the market will reach $19.8 billion by 2033 at an 11.1% compound annual growth rate. The Business Research Company projects $16.87 billion by 2030, while Mordor Intelligence expects $23.09 billion by 2031 at a 15.42% CAGR. These forecasts collectively point toward sustained expansion through the next decade.
Adoption is widespread, yet utilization remains uneven
A global monday.com survey commissioned through Qualtrics found that 82% of respondents use work or project management software to improve organizational efficiency. The same research found that 57% had experienced an increase in the number of workplace tools they use. Employees at the largest enterprises reported a 71% utilization rate, exposing a meaningful gap between software availability and regular operational use.
That gap explains one of the market’s central tensions. Companies continue purchasing agile platforms, Scrum systems, Kanban applications, and communication tools, while users still rely on spreadsheets, private notes, email threads, and disconnected departmental systems.
The 2026 market therefore contains three overlapping types of demand:
First-time adoption, especially among growing businesses leaving spreadsheets and messaging apps.
Replacement demand, where organizations have software but struggle with usability, reporting, integrations, or governance.
Consolidation demand, where companies want fewer platforms carrying more connected workflows.
The third category is becoming especially important. Atlassian’s 2025 State of Teams research surveyed 12,000 knowledge workers and 200 executives and found that teams spend approximately 25% of their time searching for information. Only 7% of executives felt confident their teams were aligned with company goals.
For buyers, this means the strongest 2026 platform is usually the one that connects project goals, stakeholder decisions, risk information, resource capacity, and delivery data without forcing employees to search across five systems.
Cloud remains the dominant direction
Grand View Research estimated that cloud-based deployment represented approximately 57% of the market in 2025, while Mordor Intelligence placed the cloud share at 74.2%. Although the percentages vary, both studies identify cloud deployment as the largest model. Both also identify North America as the largest regional market and Asia-Pacific as the fastest-growing region.
Cloud adoption supports remote access, real-time collaboration, faster updates, and easier connection with project-management APIs, team communication systems, workforce platforms, and financial applications. Hybrid deployment is also gaining momentum among regulated organizations that need tighter data residency, security, or infrastructure control. Mordor Intelligence identifies hybrid deployment as its fastest-growing model through 2031.
The market is crowded enough to make selection difficult
Capterra’s 2026 category analysis began with more than 1,422 project management products and drew on nearly 199,909 verified reviews, including 26,777 reviews published during the preceding two years. This volume illustrates how fragmented the software category has become.
Buyers now choose among simple Kanban tools, Scrum platforms, enterprise portfolio systems, construction platforms, agency-management suites, resource-planning tools, and broad work-management ecosystems. A long feature list provides limited protection against a poor purchase. Selection quality depends on matching the platform to the organization’s workflows, decision rights, adoption capacity, reporting needs, and project methodology.
| Buyer Preference | What Buyers Expect in 2026 | Operational Value | Common Purchase Failure | Evaluation Test | APMIC Resource |
|---|---|---|---|---|---|
| Ease of adoption | New users can understand core workflows with limited formal training. | Faster rollout and lower resistance. | Selecting deep functionality that ordinary contributors avoid. | Ask five new users to complete a real workflow without guidance. | PM templates |
| AI assistance | Useful summaries, forecasting, task generation, and risk detection. | Reduces administrative work and accelerates analysis. | Buying impressive demonstrations without validated use cases. | Test AI on three historical projects with known outcomes. | AI in PM |
| Security | Encryption, access controls, audit logs, SSO, and governance. | Protects project, customer, personnel, and financial data. | Reviewing security after procurement approval. | Run a security and data-flow review before the pilot. | Software security |
| Workflow automation | Rules for assignments, approvals, reminders, and escalation. | Reduces repetitive coordination. | Automating a broken process and multiplying its defects. | Map the process before configuring automation. | Automation trends |
| Integration depth | Reliable connections with finance, CRM, HR, development, and communication tools. | Reduces duplicated entry and fragmented reporting. | Counting integrations without testing field-level behavior. | Trace one transaction across the complete toolchain. | APIs and integrations |
| Resource capacity | Workload, availability, skills, utilization, and future demand visibility. | Prevents hidden over-allocation. | Using task counts as a substitute for capacity planning. | Model three projects competing for the same specialists. | Resource allocation |
| Portfolio visibility | Unified status, risk, investment, and dependency views. | Improves prioritization across projects. | Building dashboards from inconsistent project data. | Compare five projects using one standardized view. | PPM trends |
| Hybrid methodology | Support for Agile, Waterfall, Kanban, stage gates, and custom workflows. | Allows teams to match governance with delivery conditions. | Forcing every department into one rigid method. | Configure two distinct delivery models in the pilot. | Hybrid PM |
| Reporting quality | Role-based dashboards with trustworthy live data. | Shortens reporting cycles and improves decisions. | Buying attractive dashboards fed by weak source data. | Reproduce an existing executive report automatically. | Reporting practices |
| Risk management | Risk ownership, scoring, response plans, alerts, and portfolio aggregation. | Makes emerging exposure visible earlier. | Using a static risk log disconnected from delivery work. | Connect a risk trigger to an owner and response workflow. | Risk registers |
| Financial control | Budgets, forecasts, actuals, billing, cost rates, and variance analysis. | Connects project progress with commercial performance. | Separating delivery data from financial reality. | Reconcile one completed project against finance records. | Financial management |
| Schedule control | Dependencies, baselines, milestones, critical paths, and scenario planning. | Improves forecast accuracy. | Using dates without dependency logic. | Simulate a ten-day delay and inspect downstream impact. | Gantt charts |
| Mobile usability | Fast updates, approvals, evidence capture, and field access. | Improves data freshness away from desks. | Treating mobile access as a smaller desktop interface. | Complete a field update using a standard phone. | Construction tools |
| Document control | Versioning, approvals, permissions, search, and retention. | Reduces confusion around current documentation. | Storing attachments without lifecycle control. | Trace one document from draft through approval. | Requirements control |
| Stakeholder access | Controlled guest views, approvals, comments, and client portals. | Improves transparency without exposing internal data. | Giving external users excessive access. | Test permissions using internal and external accounts. | Stakeholder engagement |
| Scalability | Stable performance across more users, workflows, projects, and data. | Prevents premature platform replacement. | Evaluating only the current team size. | Model expected usage three years ahead. | Future PMO |
| Configuration control | Flexible workflows with governance over templates and fields. | Balances local adaptation with data consistency. | Allowing every team to create incompatible structures. | Create a controlled template-change process. | Project governance |
| Data portability | Accessible exports, APIs, backups, and migration support. | Reduces lock-in and protects organizational records. | Discovering export limitations during contract exit. | Export a complete pilot project with attachments and history. | Integration strategy |
| Time tracking | Low-friction time capture connected to projects, clients, and budgets. | Supports utilization and profitability analysis. | Creating a time-entry burden that weakens data quality. | Measure completion time for one weekly timesheet. | Workforce software |
| Quality control | Checklists, defects, acceptance criteria, audits, and corrective actions. | Connects delivery speed with output quality. | Tracking completion without verifying acceptance. | Run one deliverable through the full quality workflow. | TQM terminology |
| Procurement workflows | Requests, approvals, supplier milestones, contracts, and obligations. | Improves control over third-party dependencies. | Managing procurement separately from the project schedule. | Connect one supplier delay to project impact. | RFP, RFQ and RFI |
| Vendor management | Performance, deliverables, issues, payments, and contract visibility. | Strengthens supplier accountability. | Measuring vendor activity without measuring outcomes. | Create a supplier scorecard from pilot data. | Vendor management |
| Agile execution | Backlogs, boards, Sprints, releases, estimation, and flow metrics. | Supports adaptive product delivery. | Using Agile labels while retaining slow approval structures. | Run one real Sprint from planning through review. | Agile glossary |
| Knowledge management | Searchable decisions, lessons, requirements, and project context. | Reduces repeated discovery and information loss. | Separating work records from project knowledge. | Ask a new user to locate a historical decision. | Project closure |
| Executive alignment | Clear links between investments, goals, benefits, and delivery status. | Supports portfolio-level decisions. | Reporting project activity without strategic relevance. | Trace one initiative to an organizational objective. | PM leadership |
| Training support | Role-based onboarding, documentation, coaching, and adoption analytics. | Turns purchased capability into actual usage. | Allocating budget to licenses while starving implementation. | Review onboarding completion and feature adoption after 30 days. | Future PM skills |
| Pricing clarity | Visible costs for users, storage, AI, integrations, support, and add-ons. | Improves total-cost forecasting. | Comparing entry prices instead of full operating costs. | Build a three-year total-cost model. | Budget pressures |
| Responsible AI | Transparent outputs, permissions, review controls, and data protections. | Allows automation without surrendering accountability. | Allowing generated recommendations to bypass human review. | Document who validates each AI-supported decision. | AI adoption |
2. Project Management Software Adoption Patterns in 2026
The high headline adoption rate hides major differences in maturity. Some organizations use one governed platform across strategy, portfolios, projects, resources, and reporting. Others use a project tool as a digital checklist while financial data, risks, requirements, and decisions remain scattered across spreadsheets and email.
Software adoption should therefore be measured across four levels:
Access: employees possess accounts.
Usage: employees regularly enter and update work.
Process adoption: teams follow agreed workflows inside the platform.
Decision adoption: leaders rely on the resulting data when making choices.
Many implementations reach the first two levels and stall before the third. This creates a painful operating condition: employees perform additional data entry while executives still request manually assembled reports. The organization pays for software, maintains old systems, and adds administrative effort.
Strong adoption connects project execution, monitoring and control, project reporting, and project closure through one defined lifecycle.
Smaller organizations prefer speed and simplicity
Small businesses typically value fast setup, understandable pricing, templates, visual boards, basic automation, and integrations with their existing communication and accounting systems. Their operational pain often comes from unclear ownership, missed handoffs, and information buried inside chat threads.
For these buyers, a lightweight Kanban platform, accessible project template library, practical team communication tool, and reliable API ecosystem often create more value than sophisticated portfolio functionality.
The biggest small-business risk is early overconfiguration. A growing company may attempt to replicate every possible process before users establish basic habits. A stronger rollout begins with intake, assignment, due dates, status, dependencies, and reporting. Resource planning, financial controls, and automation can follow once the underlying data becomes reliable.
Mid-market companies prioritize integration and standardization
Mid-sized organizations usually experience fragmentation first. Marketing, technology, operations, sales, HR, and finance may each choose separate systems. Leadership then struggles to compare priorities, capacity, and progress across departments.
These companies increasingly favor platforms that combine workforce planning, cross-team reporting, resource allocation, and configurable project governance. They also need integrations with CRM, finance, HR, support, document storage, and communication systems.
The pain point appears when standardization becomes centralization without flexibility. Departments then rebuild their old processes outside the platform. Effective governance defines a shared minimum data model while allowing controlled variations for Agile work, Waterfall delivery, construction projects, and operational workflows.
Enterprises prioritize governance, security, and portfolio intelligence
Large enterprises accounted for approximately 65% of 2025 market revenue in Grand View Research’s model and 60.35% in Mordor Intelligence’s analysis. Their exact estimates differ, while both identify large enterprises as the largest spending segment.
Enterprise buyers require granular permissions, SSO, audit trails, portfolio structures, resource hierarchies, financial integrations, data residency controls, configurable workflows, and administrative governance. They also need systems that connect PMO strategy, portfolio management, project financial control, and executive reporting.
Enterprise failure usually arrives through complexity. Administrators build hundreds of fields, workflows, reports, and approval rules. Users then face a system designed for governance teams rather than daily work. The resulting low adoption produces incomplete data, which leads leaders to distrust dashboards and request manual reporting.
The answer is disciplined configuration: every required field should support a decision, control, compliance obligation, integration, or meaningful metric.
Hybrid project management has become the leading methodology preference
Capterra’s 2025 global Project Management Software Trends Survey involved 2,545 management-level software decision-makers across 11 countries. It found that 41% of respondents use hybrid project management methodologies, up from 21% in 2021.
This shift increases demand for tools that support Scrum backlogs, Kanban flow, Waterfall milestones, and formal governance gates inside one environment.
A construction program may use predictive schedules for procurement and regulatory approvals while using iterative planning for design coordination. A technology transformation may retain fixed financial gates while product teams operate through Sprints. A strong platform handles these combinations without corrupting portfolio reporting.
Industry-specific workflows are becoming a stronger adoption driver
Technology and telecom remain the largest industry segment in major market estimates. Healthcare is identified by Mordor Intelligence as the fastest-growing end-user segment, while Grand View Research forecasts especially strong growth in manufacturing.
Industry-specific demand changes the evaluation criteria:
Construction teams need drawings, field updates, contractors, change control, safety records, and construction scheduling.
Professional-services firms need utilization, time capture, billing, margins, and resource allocation.
Healthcare organizations need permissions, auditability, clinical-system integration, and strong risk controls.
Government programs need procurement, approvals, records, accountability, and vendor-management controls.
Software teams need backlog management, releases, defects, development integrations, and Agile metrics.
Educational institutions often need accessible workflows, grants, events, facilities, and specialized education project software.
Generic task functionality has become widely available. Competitive differentiation increasingly comes from how accurately a platform reflects the buyer’s operating environment.
3. What Buyers Prefer: AI, Security, Integration, and Usability
Capterra’s global survey found that 55% of buyers identified AI functionality as the leading trigger behind their most recent project management software purchase. Two-thirds of surveyed businesses were increasing spending to add tools, functionality, services, or support rather than simply absorbing price increases.
AI demand is strongest where it reduces a measurable burden. Valuable use cases include:
Drafting project plans from structured inputs
Converting meetings into decisions and action items
Predicting delay and resource risks
Summarizing portfolio status
Identifying missing dependencies
Producing first drafts of stakeholder updates
Recommending task owners based on skills and workload
Detecting changes across schedules, budgets, and risks
These capabilities connect naturally with machine-learning estimation, AI-driven project innovation, automated reporting, and future PM software integration.
AI adoption is moving faster than implementation capability
An Association for Project Management survey of 1,000 UK project professionals found that 70% said their organization was already using AI, while another 29% said adoption was planned. Among respondents seeing benefits, 50% cited task and schedule automation, 50% resource allocation, 50% risk analysis and forecasting, 49% reporting and dashboarding, and 43% stakeholder communications.
Capterra’s global survey also found that 41% of respondents viewed AI adoption issues as their leading software challenge. Skill gaps, weak onboarding, and workflow misalignment were prominent barriers. Thirty-nine percent reported insufficient AI skills, while 36% identified difficulty integrating new tools into existing workflows.
This creates a sharp buyer lesson: AI functionality produces value when the organization has defined processes, reliable data, trained users, and review controls. A platform can generate a risk forecast, while the project team must still validate assumptions, understand the source data, and decide what action to take.
Teams preparing for AI-supported delivery should strengthen risk analysis, schedule forecasting, resource management, and stakeholder communication alongside the technology investment.
Security has become a purchasing criterion and an adoption condition
Capterra found that 71% of buyers ranked security as a top concern, making it the leading source of both satisfaction and dissatisfaction.
Modern project platforms may contain customer data, budgets, contracts, employee workloads, product plans, intellectual property, risk records, and strategic priorities. AI features introduce additional questions around training data, prompt retention, model providers, permissions, and output governance.
A serious security review should examine:
Encryption in transit and at rest
Authentication and SSO
Multi-factor authentication
Role-based permissions
Audit logs
Data residency
Backup and recovery
Retention controls
Subprocessors
API permissions
AI data handling
Export and deletion processes
Relevant regulatory and ISO requirements
These controls should align with ISO terminology, project governance, risk-response planning, and current cybersecurity concerns.
Integration quality now carries more value than integration quantity
A vendor may advertise hundreds of integrations while supporting only shallow data exchange. Buyers should inspect whether the connection supports two-way synchronization, custom fields, permissions, attachments, historical data, error handling, and workflow triggers.
A project platform becomes operationally valuable when it connects:
Sales opportunities to delivery intake
Approved work to resource demand
Project time to billing
Procurement milestones to schedules
Product issues to development work
Project status to executive reporting
Employee data to skills and capacity
Financial actuals to project forecasts
This is why project-management APIs, workforce-management platforms, communication systems, and financial-management controls should be evaluated as one connected architecture.
Buyers increasingly prefer outcome visibility
Traditional tools concentrated on tasks completed, deadlines, and percentage progress. Mature buyers increasingly ask whether the system connects work with benefits, customer outcomes, revenue, cost reduction, risk reduction, quality, or strategic objectives.
Atlassian’s research found that only 7% of executives felt confident their teams were aligned with company goals, while 89% said their organizations needed to move faster to remain competitive.
This demand supports the growth of portfolio management, earned-value analysis, agile outcome metrics, and stronger executive reporting.
A useful dashboard should help leaders answer:
Which initiatives support current strategic objectives?
Which investments are consuming the most constrained resources?
Which benefits remain achievable?
Which risks require intervention?
Which projects should be accelerated, changed, paused, or closed?
Usability remains the silent driver of realized value
Sophisticated AI, reporting, and portfolio features provide little value when team members avoid updating the system. Usability should be tested through real workflows rather than screenshots.
Ask users to create a project, receive work, update status, log a risk, request an approval, find a decision, and produce a report. Measure completion time, errors, confusion, and reliance on administrator assistance.
The platform should support practical project execution, clear monitoring and control, efficient stakeholder engagement, and consistent project closure without turning each update into an administrative exercise.
Select the obstacle causing the greatest operational cost. Your result will identify the highest-leverage corrective action.
4. Software Preferences by Company Size, Team, and Industry
The market’s product diversity exists because different buyers experience different forms of operational friction. A ten-person creative agency, a global construction company, and a regulated government PMO all manage projects, while their data, risks, users, and governance requirements differ substantially.
Startups and small teams
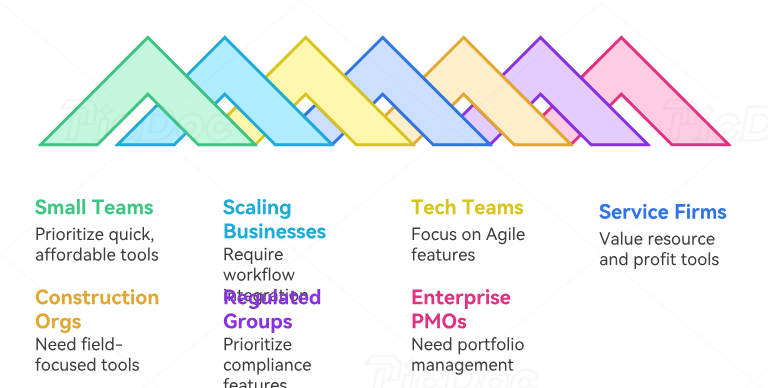
Small teams usually prefer quick implementation, visual boards, affordable per-user pricing, mobile access, templates, and lightweight automation. Their strongest need is often shared visibility: who owns the work, what is due, what is blocked, and what requires a decision.
Suitable categories include Kanban software, flexible Agile project platforms, accessible communication tools, and reusable project-management templates.
A small team should resist paying for enterprise portfolio functionality before it has consistent project intake, ownership, and completion processes. The first purchase should remove chaos quickly and create enough structure for growth.
Scaling businesses and cross-functional departments
Growing businesses need stronger workflow configuration, integrations, dashboards, permissions, forms, resource views, and automation. They often manage client work, internal initiatives, marketing campaigns, product development, hiring, and operations through the same platform.
Their selection criteria should include workforce management, project reporting, resource allocation, and integration with their project-management API stack.
These buyers frequently encounter tool sprawl. A department may introduce one platform for tasks, another for documentation, another for approvals, and another for reporting. The right platform reduces duplication while allowing specialized systems to remain where they deliver clear value.
Software-development and technology teams
Technology teams usually prioritize backlog management, issue tracking, releases, defects, dependencies, development integrations, automation, and searchable technical context.
Their preferred platforms should support Scrum terminology, product and Sprint backlogs, Sprint planning, and Agile metrics.
The main buying mistake is selecting a system that works well for developers while excluding product, finance, marketing, customer support, and executive stakeholders. Technology organizations increasingly value platforms or integrated ecosystems that connect development work with broader goals and portfolio decisions.
Professional-services firms and agencies
Professional-services buyers care deeply about resource demand, skills, utilization, time capture, project budgets, client access, billing, and profitability. Basic task tracking provides limited commercial insight when the firm cannot see who is available, which engagements are profitable, or where unbilled work is accumulating.
These firms should evaluate resource-allocation features, workforce-management tools, financial controls, and stakeholder collaboration.
A strong pilot should track one complete client engagement from opportunity or intake through staffing, delivery, change requests, invoicing, and margin reporting.
Construction, engineering, and infrastructure organizations
Construction buyers need document control, drawings, RFIs, submittals, contractors, procurement, field reporting, budgets, schedules, safety, change management, and mobile evidence capture.
Generic task-management tools may support office coordination, while large projects require deeper construction software, formal vendor management, schedule control, and cost-management capability.
Construction teams should test mobile performance under realistic field conditions. Fast photo capture, offline access, drawing retrieval, issue assignment, and approval workflows often matter more than polished executive dashboards.
Government and regulated organizations
Government, healthcare, finance, defense, and other regulated sectors place greater weight on auditability, data residency, procurement controls, permissions, retention, accessibility, and compliance.
Their platforms should support documented project governance, RFP and procurement workflows, ISO-related controls, and detailed risk registers.
Hybrid deployment can appeal to organizations that need cloud collaboration while retaining selected data or infrastructure controls. Buyers should verify how the platform handles regional hosting, backups, encryption, audit evidence, AI processing, and contract exit.
Enterprise PMOs
Enterprise PMOs require demand management, portfolio prioritization, capacity planning, investment governance, scenario modeling, financial visibility, and executive reporting.
Their preferences align with future PMO responsibilities, portfolio-management trends, project governance, and earned-value management.
A PMO should evaluate whether the software improves portfolio decisions. Producing prettier status reports provides limited value when leaders still cannot compare initiatives, identify capacity conflicts, or redirect investment.
5. The 2026 Software Buying Playbook and Market Outlook Through 2030
A disciplined purchase process begins with operational problems rather than vendor demonstrations. Buyers should identify where projects lose time, money, control, or decision quality.
Common high-cost problems include:
Delayed approvals
Unclear ownership
Duplicate data entry
Inaccurate resource forecasts
Weak executive visibility
Manual reporting
Missed dependencies
Uncontrolled scope changes
Fragmented documents
Inconsistent project methods
Poor adoption
Limited financial visibility
These issues should be mapped through requirements engineering, stakeholder analysis, risk planning, and clear project-governance rules.
Step 1: Define measurable purchase outcomes
Each requirement should connect to an operational result. “We need automation” is too broad. “We need approved requests to create assigned projects automatically within five minutes” can be tested.
Useful targets include:
Reduce weekly reporting preparation by 70%
Increase active usage above 85%
Cut overdue approvals by 50%
Improve resource forecast accuracy
Eliminate duplicate project-data entry
Reduce portfolio-report production from five days to one
Raise on-time status reporting above 95%
These metrics draw on project monitoring, reporting standards, resource planning, and Agile performance measures.
Step 2: Separate mandatory requirements from attractive features
Mandatory requirements should cover the workflows, integrations, security, reporting, and governance capabilities that determine operational viability. Attractive features can improve the experience but should carry a lower score.
A weighted scorecard might allocate:
20% workflow fit
15% usability
15% integration capability
15% security and governance
10% reporting and analytics
10% resource and portfolio capability
10% total cost
5% vendor support and roadmap
The weights should change according to the buyer’s needs. A creative agency may place greater weight on usability and client collaboration. A government organization may assign more weight to security, procurement, records, and vendor controls.
Step 3: Pilot real work
A useful pilot should include a live project, realistic users, existing data, a key integration, one executive report, and one complete workflow. It should last long enough to expose adoption and configuration problems.
Pilot participants should include contributors, project managers, executives, administrators, finance, IT, security, and external stakeholders where relevant. This supports realistic stakeholder engagement, conflict resolution, project reporting, and implementation planning.
Measure:
Task completion time
User errors
Data completeness
Reporting accuracy
Integration failures
Training requests
User satisfaction
Administrative effort
Mobile performance
Workflow exceptions
Step 4: Calculate total cost across three years
License price captures only part of the investment. Buyers should include:
Implementation services
Data migration
Integration development
Administrator time
Training
Change management
Premium support
AI usage charges
Storage
Guest access
Reporting add-ons
Sandbox environments
Security features
Contract escalation
Exit and data-export costs
This model should align with project financial management, cost-control expertise, global budget pressures, and formal procurement terminology.
Step 5: Fund adoption as part of the purchase
Capterra’s finding that 41% of respondents experience AI-adoption problems reinforces a wider implementation reality: software value depends on training, workflow alignment, and user behavior.
The adoption plan should include:
Executive sponsorship
Named process owners
Role-based training
Templates
Office hours
Internal champions
Usage dashboards
Data-quality reviews
Configuration governance
A retirement plan for replaced tools
The platform should become the easiest valid route for completing work. Users return to spreadsheets when the formal process feels slower than the workaround.
What the market will reward through 2030
The available market forecasts and buyer research point toward several durable trends.
AI will become embedded inside ordinary workflows. Buyers will expect scheduling assistance, summaries, forecasting, risk detection, and task generation as standard capabilities. The competitive question will shift toward accuracy, context, governance, and measurable value. This direction aligns with the growth of AI project management and machine-learning scheduling.
Security and responsible AI will shape vendor trust. Buyers will examine data flows, permissions, model providers, retention, transparency, and human review. Platforms with visible cybersecurity controls, ISO alignment, and governance options will hold an advantage.
Consolidation will continue. The combination of 57% of employees reporting more tools and teams spending 25% of their time searching for information creates strong pressure for connected work ecosystems.
Hybrid methodology support will become expected. With 41% of Capterra respondents using hybrid approaches, buyers will increasingly reject platforms that require one rigid delivery model.
Vertical specialization will expand. Construction, healthcare, manufacturing, professional services, government, and education will continue demanding workflows built around their documentation, compliance, financial, and operational requirements. Major market studies identify IT and telecom as the largest current segment, while healthcare and manufacturing show strong growth potential.
Outcome-based reporting will gain importance. Project platforms will increasingly connect work with strategic goals, benefits, customer outcomes, financial performance, and risk reduction. This trend supports broader investment in portfolio management, future PMO models, and project leadership.
The market will continue growing because project complexity, cross-functional work, AI adoption, hybrid delivery, and distributed teams all increase the need for coordination. The winning platforms will combine technical depth with usability, governance, integration, and a clear path from daily work to executive decisions.
6. Frequently Asked Questions About the 2026 Project Management Software Market
-
Current estimates range from $8.7 billion to $11.27 billion. Grand View Research estimates $8.7 billion, The Business Research Company estimates $10.51 billion, and Mordor Intelligence estimates $11.27 billion. Differences arise from market definitions, vendor coverage, included services, and estimation methods.
All three forecasts indicate double-digit growth. Buyers should use the range as evidence of sustained category expansion while evaluating actual software through requirements control, procurement practices, and vendor-management criteria.
-
A monday.com global survey commissioned through Qualtrics found that 82% of respondents use work or project management software to improve organizational efficiency. The category includes broader work-management platforms, so the figure should be interpreted as work and project software adoption rather than exclusive use of dedicated enterprise PM systems.
Actual maturity varies across task management, project reporting, portfolio management, and resource planning.
-
The strongest preferences include AI assistance, security, automation, integrations, usability, reporting, resource planning, portfolio visibility, mobile access, and hybrid-methodology support. Capterra found that 55% of surveyed buyers identified AI as the leading trigger for their latest purchase, while 71% ranked security as a top concern.
Organizations should connect these features with practical risk management, resource allocation, reporting standards, and API requirements.
-
AI has become an important buyer preference, especially for summaries, scheduling, forecasting, risk detection, and repetitive administrative work. Its value depends on data quality, workflow design, user skills, and human review.
Capterra found that 41% of respondents viewed AI adoption as a major software challenge, while APM found strong reported benefits in scheduling, resource allocation, risk analysis, reporting, and stakeholder communication.
The best approach starts with two controlled use cases supported by AI governance, risk controls, and clear stakeholder accountability.
-
Yes. Major market studies identify cloud deployment as the largest model, although their estimated market shares differ. Cloud systems support real-time collaboration, remote access, rapid updates, and easier integration. Hybrid deployment is also growing where organizations need stronger control over selected infrastructure or data.
Deployment decisions should consider cybersecurity requirements, ISO standards, integration architecture, and geographic data rules.
-
Common causes include weak process design, excessive configuration, inadequate training, poor integration, unclear ownership, low executive sponsorship, duplicate systems, and dashboards built on incomplete data.
Capterra’s research found that skill gaps, onboarding problems, and workflow misalignment contribute heavily to AI-related adoption difficulties. monday.com’s research also found lower actual utilization among the largest enterprises despite widespread tool access.
Implementation should combine requirements engineering, stakeholder engagement, change governance, and measurable adoption targets.
