
Understanding Gantt Charts: Essential Terms Explained
Gantt charts look simple until a real project starts slipping. Then every weak dependency, every fake milestone, every overloaded resource, and every hand-waved finish date shows up at once. That is why project managers who only know how to “read the bars” usually struggle when execution gets messy.
This guide breaks down the essential Gantt chart terms that actually matter in delivery. It is built to help you interpret schedules correctly, challenge bad planning assumptions, communicate delays with precision, and use timeline language in a way that strengthens decision-making instead of decorating status reports.
1. Why Gantt chart language matters more than most project teams admit
A Gantt chart is only useful when the terms behind it are understood correctly. Otherwise it becomes a polished lie. Bars look organized, dates look authoritative, and stakeholders feel reassured right until a missed dependency, overloaded specialist, or fake milestone blows through the schedule. That is why Gantt terminology sits at the center of real scheduling discipline, not just visual planning.
A serious PM has to connect Gantt terms with broader ideas from project scheduling, critical path method, risk management, project communication, and issue tracking. If the language is weak, the execution gets weak. Teams stop distinguishing effort from duration, start ignoring resource conflicts, and quietly treat baseline changes like harmless admin edits when they are actually erasing accountability.
Hiring managers notice this fast. They can tell whether someone truly understands sequencing or merely knows how to drag tasks across software. The difference shows up when candidates talk about resource allocation, budget impact, procurement timing, contract dependencies, and stakeholder alignment with actual scheduling logic behind the words.
This glossary is built to help with that deeper level. It should make your schedules stronger, your status conversations sharper, your interviews more credible, and your ability to challenge unrealistic timelines far more dangerous in the best possible way.
2. The foundational Gantt chart terms every project manager needs to understand cleanly
The first term is task. A task is a defined unit of work with a start date, finish date, and duration. That sounds simple, but weak schedules fall apart here. Tasks are often too broad, too vague, or too passive. “Testing” is weak. “Execute integration test cycle for payment gateway” is usable. Good task naming improves project reporting, dashboard visibility, document control, and knowledge transfer.
A subtask is a smaller piece of work nested under a larger activity. It gives more control when a larger task hides too much complexity. The trap is over-detail. A Gantt chart should improve management, not become a diary of every keystroke.
A summary task is a parent grouping that rolls up related activities. It gives stakeholders a higher-level view of a workstream without forcing them to read every detail. Good PMs understand that summary tasks help communication, while real control still happens at the lower task level.
A milestone is a zero-duration event marking a meaningful point such as approval, sign-off, environment readiness, go-live, or phase completion. A milestone is not “we hope to be mostly done.” It must represent a real event with entry criteria. That matters in project initiation, quality checkpoints, governance discussions, and change-heavy delivery environments.
A dependency is the logic relationship between tasks. Without dependency logic, a Gantt chart is just a list with bars. Dependencies show which work must happen before, after, or alongside other work. The classic dependency type is finish-to-start, where a successor begins only after the predecessor ends. This is common, but teams often overuse it. Some work can begin in parallel if planned intelligently.
That brings us to start-to-start, finish-to-finish, lead, and lag. These terms shape overlap and waiting. A start-to-start dependency can shorten the timeline by allowing two work packages to begin together, often with guardrails. Lead introduces overlap by letting successor work begin early. Lag inserts a waiting period, such as drying time, legal review turnaround, or procurement wait. Used well, these terms make a schedule realistic. Used lazily, they hide sloppy thinking.
3. Critical path, float, baseline, and variance: the terms that expose whether your schedule is actually healthy
The most misunderstood Gantt term is usually critical path. It is not simply the longest-looking bar or the task that feels most important politically. The critical path is the longest sequence of dependent tasks that determines the earliest possible finish date for the project. If a task on that path slips, the project finish slips unless something else changes. That is why understanding CPM terms, project failure drivers, Agile versus waterfall planning realities, and AI-supported planning tools becomes so valuable.
Float is the amount of time a task can move without causing damage. Total float shows how much delay is possible before the project finish date changes. Free float shows how much delay is possible before a successor is affected. This is where bad PM behavior often appears. Teams see float and start treating it like spare time. It is not spare time. It is fragile schedule flexibility that can vanish quietly.
A near-critical path is a path close to becoming critical. Strong PMs watch this carefully. A schedule can look stable while a near-critical chain is quietly burning its buffer. Once that float disappears, the critical path shifts and executives start acting shocked by a delay the plan had been whispering about for weeks.
A baseline is the approved version of the schedule used for comparison. It matters because without a baseline there is no disciplined way to talk about drift. Teams can claim they are “still on track” even after pushing dates around three times. Strong PMs preserve baseline integrity and only re-baseline through visible control, not quiet cleanup.
Variance is the difference between the baseline and current reality. It can show up in start dates, finish dates, duration, or progress. On its own, variance is descriptive. Mature PMs make it useful by linking it to root cause, impact, and action. That is where budget tracking, project analytics, software feature trends, and success factors research all become part of a more serious scheduling conversation.
4. Resource and progress terms that stop Gantt charts from becoming fantasy art
A schedule can be logically perfect and still be unusable if the same person is booked on five critical tasks at once. That is why Gantt literacy must include resource language.
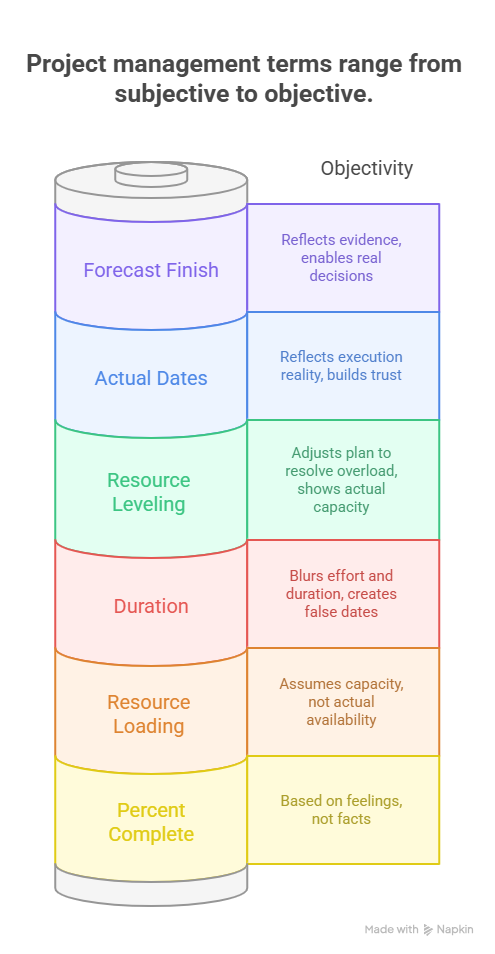
Duration means the elapsed working time needed to complete a task. Effort means the total labor required. These are not the same thing. A task might require sixteen hours of effort but still take five working days because the specialist is only partially available. PMs who blur effort and duration produce misleading finish dates and then blame delivery teams for missing plans that were never realistic.
Resource loading is the assignment of people, tools, or equipment to scheduled work. It shows whether the chart reflects actual capacity or merely hopeful sequencing. Resource leveling means adjusting the plan to resolve overload by shifting dates, redistributing work, or changing assignment patterns. Many teams resist leveling because it makes the finish date look worse. In reality, it makes the schedule more honest.
Percent complete is another dangerous term. Used weakly, it becomes a vibe. Used well, it is tied to objective completion rules. A task is not 90 percent complete because it feels close. It is 90 percent complete because defined deliverables, tests, reviews, or acceptance steps have been met. This is where project quality language, Six Sigma thinking, mobile PM tools, and software for small business PM teams can help only if the PM already has discipline.
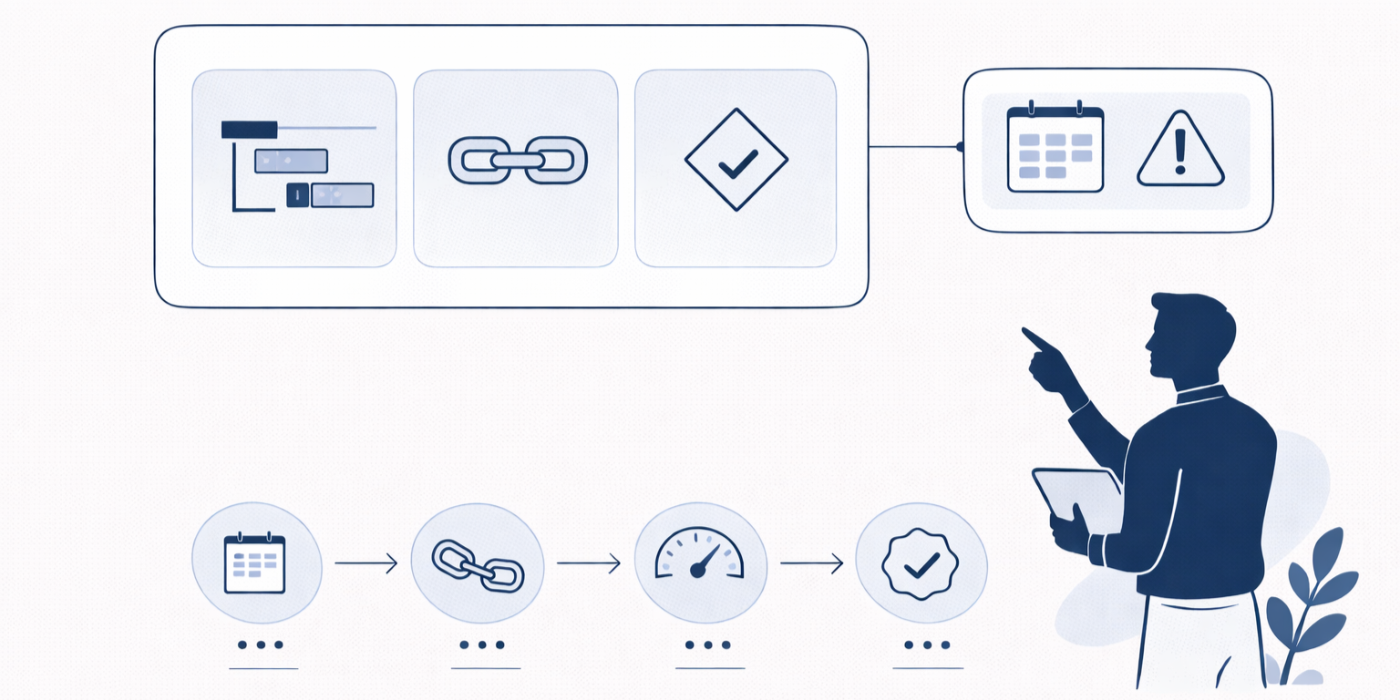
Then there are actual start, actual finish, and forecast finish. Actual dates tell the truth of execution. Forecast finish tells the truth of trajectory. Too many PMs keep planned finish visible long after reality has already shifted, usually because the revised date is politically painful. That delay in forecast honesty destroys trust. The sooner the forecast reflects evidence, the sooner leaders can make a real decision.
5. How to use Gantt chart terms in real project work, interviews, and schedule recovery
The real value of Gantt terminology appears when you use it to challenge weak plans and protect delivery. For example, if a sponsor demands an earlier launch, the right response is not simply “we will try.” A better response is to discuss schedule compression through selective overlap, resource changes, or scope tradeoffs, then show the effect on risk, cost, and dependency stress. That level of conversation links naturally with cost management, project budgeting, PM software for analytics, and future PM skill demands.
In interviews, Gantt chart terms help you sound like someone who has actually managed execution. Say you inherited a plan with hard constraints, fake milestones, and invisible dependencies. Explain how you rebuilt task logic, re-established the baseline, exposed the true critical path, leveled overloaded resources, and used forecast dates to force timely escalation. That sounds fundamentally different from saying you “managed timelines.” Panels remember the first version.
In active delivery, watch for slack erosion. This is the slow loss of schedule flexibility on near-critical work. It often happens quietly while teams focus only on the current critical path. By the time the path shifts, the project looks like it failed suddenly when it had actually been weakening for weeks.
Also watch for constraints that were inserted to make the chart appear neat. Hard-coded dates, mandatory starts, and politically selected finish points can destroy the natural logic of the schedule. Strong PMs question these early. They know a clean-looking chart can still be mathematically fragile and operationally dishonest.
These skills become even more valuable as careers grow into government PM roles, portfolio leadership, consulting paths, remote PM work, and director-level progression. Bigger roles require stronger schedule language, not prettier charts.
6. FAQs: Understanding Gantt charts and essential scheduling terms
-
They treat the chart as a visual checklist instead of a logic model. Real value comes from task definition, dependency quality, baseline control, and resource realism.
-
Duration is elapsed working time on the calendar. Effort is the total labor required. A task can require little effort but still have a long duration because of waiting, review cycles, or partial availability.
-
A long task matters only if it sits on the path controlling the finish date. A shorter task on the critical path can be more dangerous than a longer non-critical task.
-
Not exactly. Float is scheduling flexibility created by network logic. A buffer is usually a deliberate protective allowance inserted into a plan. Float can disappear without anyone explicitly spending a buffer.
-
Usually because actual progress is updated late, dependency assumptions go stale, resource overload is ignored, and teams cling to planned dates after forecast reality has changed.
-
Only after approved and material change, not to hide slippage. Re-baselining should follow control, visibility, and stakeholder agreement.
-
Yes, especially for cross-team dependencies, release windows, approvals, procurement timing, and leadership reporting. They are often most useful above the sprint level.