
Report on Project Management Office (PMO) Effectiveness: Original Data & Trends
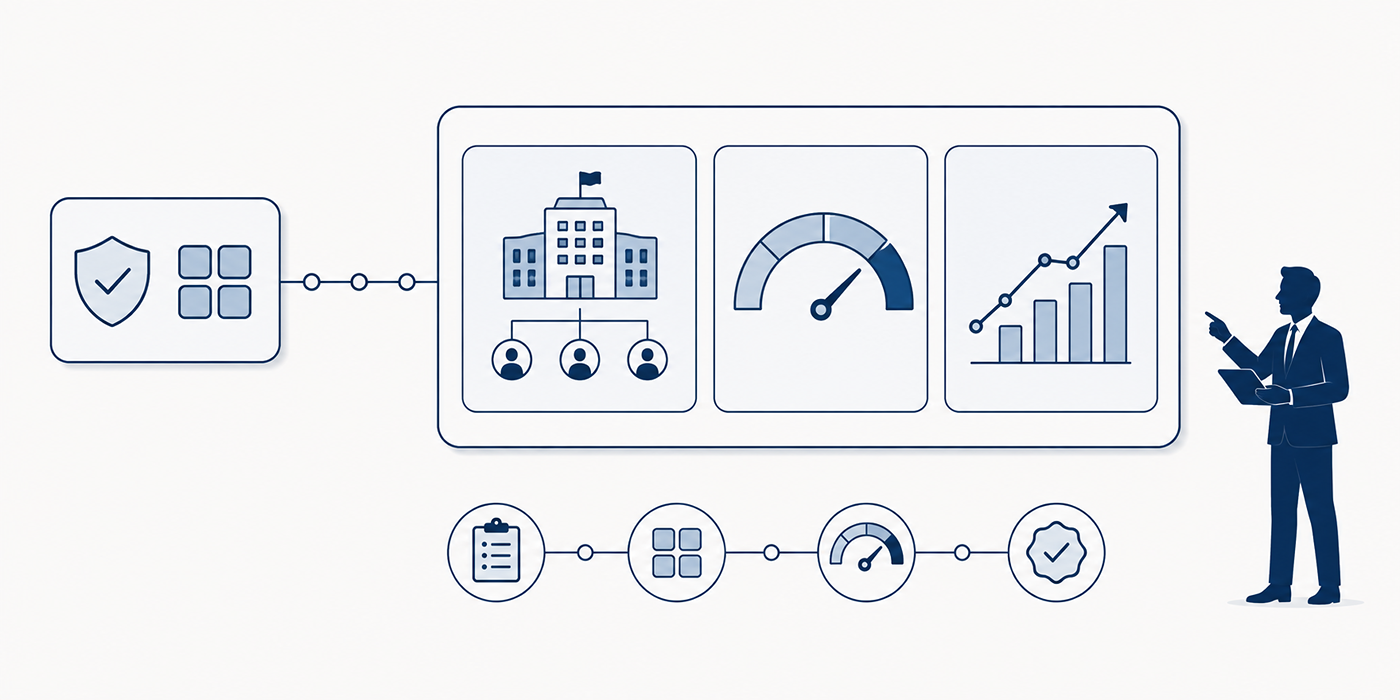
PMO effectiveness now depends on how quickly an organization converts strategy into measurable value. A credible Project Management Office improves investment selection, delivery predictability, resource allocation, executive decisions, and benefit realization. This report combines recent industry findings with an original APMIC 28-metric diagnostic for evaluating portfolio performance, project governance, operational maturity, and the strategic contribution of a modern PMO.
1. Executive Findings: What the PMO Effectiveness Data Reveals
This report separates published industry benchmarks from the original APMIC PMO Effectiveness Index introduced below. The published figures describe respondents within each source’s research sample. The APMIC index converts recurring effectiveness themes into a practical assessment framework. The percentages from different studies have not been pooled because their samples, definitions, industries, and maturity classifications differ.
The strongest finding is the widening gap between PMO responsibility and organizational delivery capability. Wellingtone’s 2026 research reports that 67% of respondents expect their PMO’s scope and responsibilities to increase. At the same time, only 36% say their organizations always or mostly complete projects on time, 44% are somewhat or very dissatisfied with current project-management maturity, and 72% spend at least half a day collating reports every month. This creates a painful operating contradiction: leadership expects stronger portfolio intelligence, while many PMOs remain trapped in manual project reporting, weak data integration, and retrospective administration.
PMI’s research shows what changes when a PMO becomes strategically effective. Eighty percent of high-performing PMOs excel at delivering customer value, compared with 43% of low-performing PMOs. Organizations with leading PMOs also report stronger technology-enabled value creation and much greater agility. Sixty-two percent of respondents associated with top PMOs rate organizational agility highly, compared with 25% among low-performing PMOs. These differences connect PMO performance with digital transformation, stakeholder engagement, adaptable delivery, and disciplined project execution.
Technology contributes most when the PMO knows which decisions the technology should improve. PMI reports that 80% of high-performing PMOs use technology to enable value, while 59% train people in new ways of working and 73% formally measure and review project performance. PM Solutions separately reports that more than 36% of organizations with PMOs use AI-supported practices, rising to 61% among high-performing PMOs. The signal is clear: AI in project management produces greater value when it sits inside reliable monitoring and control, clear accountability, capable teams, and governed software integration.
PM Solutions’ 2025 research places the financial and strategic impact in sharper terms. High-performing PMOs were associated with a 60% improvement in alignment with business objectives, 57% improvement in fulfilling strategic objectives, 56% improvement in successful project outcomes, 53% improvement in productivity and time-to-market, and 53% improvement in resource utilization. These results support a wider definition of effectiveness covering strategic alignment, investment value, project financial management, organizational capacity, and market responsiveness.
The most dangerous PMO pain point appears when reporting activity is mistaken for management impact. A dashboard can be delivered on time while its data is stale, its forecasts are politically adjusted, its benefits remain unverified, and its red statuses trigger no decision. The PMO then becomes a polished reporting layer over unresolved project risks, unstable priorities, hidden resource conflicts, and weak sponsorship. Effective measurement must expose those conditions early enough for leadership to intervene.
2. The Original APMIC PMO Effectiveness Index
The APMIC PMO Effectiveness Index converts the 28 metrics above into a 100-point organizational score. Its purpose is to reveal where the PMO creates measurable enterprise value and where its services produce reporting volume without improving decisions. The model complements established project-management terminology, portfolio-management practices, and governance principles.
Score every metric from zero to four:
0 — Absent: The metric lacks an agreed definition, owner, source, or baseline.
1 — Informal: Teams produce occasional data through inconsistent methods.
2 — Controlled: The organization applies a standard method with recurring reporting.
3 — Decision-grade: Leaders use the metric to make documented portfolio or delivery decisions.
4 — Value-proven: The organization can demonstrate sustained improvement and quantified business impact.
Strategic alignment and value: 25 points
This category covers strategic alignment, objective coverage, benefits realization, time-to-value, and value leakage. A high score requires traceability from enterprise objectives to funded initiatives, accountable benefit owners, and evidence that completed work produces the result promised in the business case.
The most common failure occurs after delivery. Project teams complete technical outputs, project closure transfers ownership, and the expected benefit receives little further attention. The PMO should preserve a benefits register beyond implementation, connect benefits with financial-management controls, and escalate deviations while corrective options remain available.
Delivery predictability: 20 points
This category evaluates schedule, budget, scope, forecasting, milestones, risks, and dependencies. Predictability means leaders receive a reliable view of future performance early enough to change the outcome. A project that turns red one week before a missed launch demonstrates weak monitoring and control, even when its final status report is numerically accurate.
Use earned value management, milestone analysis, Gantt-chart logic, delivery-flow measures, and risk-response planning according to project type. Forecast quality should be assessed through historical forecast error rather than confidence statements from delivery teams.
Portfolio capacity and flow: 15 points
Capacity performance covers resource forecasts, conflicts, skill coverage, and throughput. Many PMOs build demand lists without establishing how much work the organization can finish. That weakness creates crowded portfolios, shared specialists assigned beyond availability, hidden queues, and constant priority switching.
A strong PMO combines resource-allocation controls, portfolio sequencing, agile estimation, operational workload, procurement lead times, and external vendor capacity. Leadership should see the cost of approving a new initiative before that initiative displaces existing commitments.
Governance and assurance: 15 points
This dimension evaluates decision speed, stage gates, change decisions, and recurring assurance findings. Governance earns a high score when it produces timely, accountable choices with evidence proportional to the investment and risk.
Excessive governance causes long approval queues and unofficial workarounds. Weak governance allows projects to continue despite deteriorating business cases, unmanaged changes, and unresolved dependencies. The PMO should apply proportionate project governance, defined escalation thresholds, requirements control, and clear decision rights.
Data and technology: 15 points
This category assesses data completeness, reporting effort, automation, and delivery-method fit. It rewards information architecture that reduces reconciliation work and produces faster decisions.
Technology maturity involves more than purchasing a portfolio platform. The PMO must govern project definitions, status dates, financial periods, risk classifications, benefit categories, and data ownership before implementing project-management software, APIs and integrations, or machine-learning forecasts. Automation applied to inconsistent data distributes inconsistency faster.
Capability and stakeholder trust: 10 points
The final category measures project-manager competency, sponsor effectiveness, stakeholder confidence, and PMO service adoption. The PMO needs people who understand project leadership, industry economics, organizational politics, conflict resolution, and executive communication.
Interpret the final score through five maturity bands:
0–39: Administrative PMO. Reporting depends on manual collection, authority is limited, and value evidence is weak.
40–59: Control PMO. Standards exist, though adoption, forecasting, and decision impact remain inconsistent.
60–74: Enabling PMO. Portfolio visibility, coaching, governance, and delivery support produce measurable improvements.
75–89: Strategic PMO. Investment decisions, benefits, capacity, and strategic execution operate through integrated evidence.
90–100: Enterprise value PMO. The PMO shapes strategy execution, continuously improves delivery capability, and proves financial or mission impact.
Avoid turning the index into a compliance contest. Every score should include evidence, trend direction, business consequence, and a named improvement owner. A carefully justified score of 62 provides more decision value than an unsupported score of 91.
3. Seven Trends Reshaping PMO Effectiveness in 2026
Trend 1: PMO mandates are expanding faster than PMO capacity
Wellingtone reports that 67% see PMO scope and responsibilities increasing. Expanded mandates commonly include portfolio management, benefits, resource planning, assurance, change enablement, sustainability, data governance, and strategic reporting. PMO leaders need a service catalogue specifying each service’s customer, output, value measure, capacity requirement, and service owner. Current research indicates that only 40% of PMOs have a defined service catalogue explaining the value of each service.
Without that discipline, the PMO becomes the default destination for every organizational coordination problem. Reporting expands, meetings multiply, and strategic analysis receives whatever capacity remains. Services should earn continued investment through adoption, cycle-time improvement, decision quality, risk reduction, or benefit delivery.
Trend 2: Benefits and time-to-value are replacing document compliance
High-performing PMOs increasingly define success through customer and organizational value. PMI found that 80% of high-performing PMOs excel at customer-value delivery. This reflects a shift toward benefit ownership, incremental release, customer evidence, and strategic outcomes.
A modern dashboard should connect project execution with benefit measures, stakeholder expectations, financial outcomes, adoption, and operational performance. Completion remains important, though completion without realized value represents an unfinished investment.
Trend 3: AI is moving from experimentation into PMO operations
AI use is growing in communication, reporting, analysis, planning, and risk identification. PM Solutions reports AI-supported practices in more than 36% of organizations with PMOs and in 61% of high-performing PMOs. PMI also finds that leading PMOs are twice as likely as other organizations to use AI.
High-value applications include automated status summarization, dependency detection, risk clustering, meeting-action extraction, forecast comparison, and document-quality checking. These applications require controlled data access, human review, cybersecurity safeguards, audit trails, and explicit accountability. The PMO should measure hours saved, forecast improvement, decision lead-time reduction, error rates, and user trust for every AI use case.
Trend 4: Adaptive governance is replacing one-method standardization
PMOs are increasingly supporting predictive, agile, hybrid, and tailored approaches. PMI describes high-performing PMOs as functions that empower teams to select appropriate delivery methods while preserving execution quality and standards. Wellingtone similarly identifies agility, flexibility, and proportionate governance as major 2026 priorities.
A high-compliance infrastructure program may require formal baselines, earned value controls, contractual gates, and detailed vendor management. A digital product may benefit from sprint planning, product backlogs, experimentation, and agile metrics. A hybrid delivery model can combine investment governance with iterative product delivery.
Trend 5: Assurance is becoming continuous and preventive
Traditional assurance often arrives after delivery problems have become expensive. Emerging practice places smaller assurance interventions around early business-case quality, schedule realism, resource readiness, architecture, procurement, benefits, and transition planning. Wellingtone identifies embedded and proactive assurance as a central 2026 trend.
The PMO should track repeated findings, action closure, recovery avoided, and the time between warning signals and intervention. A finding that appears across ten projects reveals a system weakness involving quality management, sponsorship, estimates, supplier controls, or organizational capability.
Trend 6: Business acumen is becoming a core PMO competency
PMI’s 2025 research found that only 18% of project professionals demonstrate high business acumen, while 66% fall into the moderate category. Professionals with high business acumen report stronger business-goal achievement, budget adherence, schedule adherence, and broader performance measurement.
PMO analysts therefore need more than tool fluency. They should understand revenue, cost drivers, operating models, regulatory exposure, customer economics, project financial management, strategic trade-offs, and the language executives use to allocate capital.
Trend 7: PMO effectiveness is becoming customer-facing
The PMO’s internal customers include executives, sponsors, project managers, product teams, finance, procurement, operations, and delivery partners. Each group experiences PMO value differently. Executives need decision clarity, sponsors need issue resolution, project managers need practical support, and finance needs credible forecasts.
A service catalogue, stakeholder-confidence score, and periodic service review make this value visible. The PMO can then improve its reporting services, communication platforms, coaching, assurance, templates, and portfolio routines according to evidence.
Credibility improves fastest when the PMO fixes one decision-critical weakness and proves the resulting business impact.
4. How to Build a PMO Dashboard Executives Will Use
An executive PMO dashboard should answer three questions immediately: Are we investing in the right work? Are we likely to deliver the expected value? Which decisions require attention now? Every metric should support one of these questions.
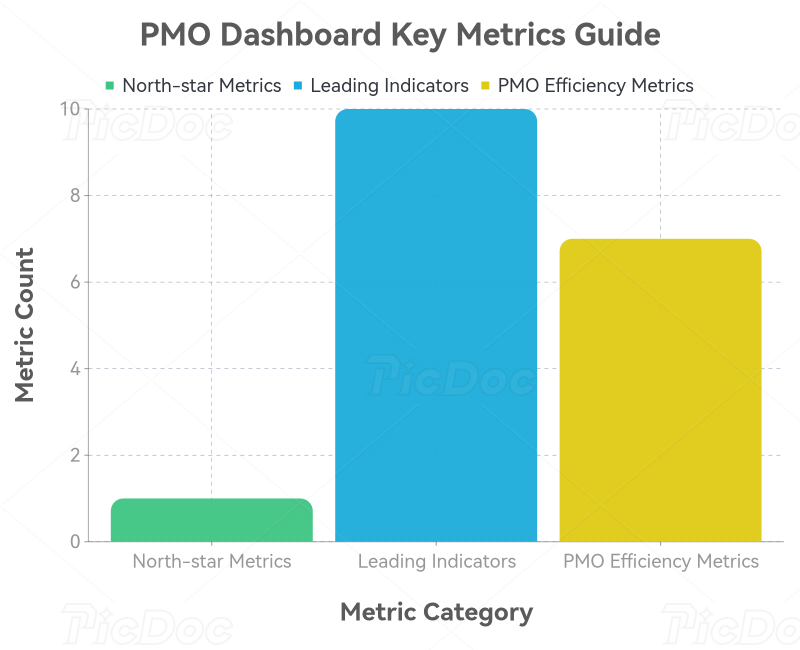
APQC advises organizations to keep a small number of strategically important KPIs, supported by a limited set of operational indicators. It also suggests that ten measures or fewer are usually sufficient for a dashboard. This principle protects leaders from a common PMO failure: presenting so many indicators that material signals disappear inside visual noise.
Establish one portfolio north-star metric
Choose a primary measure reflecting the organization’s purpose. Commercial organizations may use verified benefit realization, return on project investment, or time-to-value. Public-sector PMOs may use service outcomes, citizen impact, regulatory compliance, or mission benefits. Transformation offices may track strategic milestones and adoption.
The north-star measure should connect with portfolio priorities, financial evidence, customer outcomes, and accountable benefit owners. It should remain stable long enough for trend analysis.
Add leading performance indicators
Lagging indicators reveal completed outcomes. Leading indicators expose conditions that can still be changed. Useful leading measures include:
Milestone forecast movement.
Critical dependency aging.
Unfilled specialist roles.
Risk-action lateness.
Sponsor decision delays.
Forecast-confidence deterioration.
Change-request volume.
Benefits without assigned owners.
Teams exceeding safe capacity.
Data fields failing freshness standards.
These indicators should connect with risk registers, resource controls, schedule management, and stakeholder engagement. Their purpose is intervention rather than decoration.
Use economic tolerances
Universal red-amber-green thresholds can distort performance. A two-week delay on a regulatory project may create major penalties, while the same movement on an internal improvement project may remain manageable. Tolerances should reflect value at risk, schedule criticality, financial exposure, customer impact, compliance, and reversibility.
Every red status should state the quantified consequence, decision required, decision owner, deadline, and outcome of continued delay. This converts project reporting into an executive action system.
Display trend and confidence together
A metric without direction provides limited insight. Show the current value, previous value, forecast, target, and trend. Add a confidence indicator based on data completeness, forecast history, unresolved assumptions, and dependency exposure.
For example, a project may forecast completion within tolerance while carrying low confidence because procurement dates remain unconfirmed. The dashboard should communicate that uncertainty before the forecast moves. This approach strengthens vendor oversight, risk mitigation, and decision timing.
Measure the PMO’s own operating efficiency
The PMO should track reporting effort, service adoption, decision lead time, repeated assurance findings, stakeholder confidence, automation coverage, and time spent on analysis versus administration.
A painful warning appears when the PMO demands efficiency from project teams while carrying months of duplicate reports, unused templates, repetitive approvals, and manually maintained spreadsheets. Review the PMO service catalogue quarterly. Retire services that lack a defined customer, measurable outcome, or regulatory need.
5. A 90-Day Plan for Improving PMO Effectiveness
PMO transformation gains credibility through focused evidence. A 90-day cycle should target a small number of high-consequence weaknesses, deliver visible improvements, and establish a repeatable improvement system.
Days 1–30: Diagnose value, demand, and trust
Begin with the 28-metric APMIC assessment. Interview executives, sponsors, project managers, finance, procurement, technology leaders, and operational owners. Ask which PMO outputs they use, which decisions arrive late, which data they distrust, and which services create administrative friction.
Map the complete reporting flow from source systems to executive presentation. Record manual touches, reconciliation time, duplicate fields, inconsistent definitions, and approval delays. Review reporting terminology, existing project templates, dashboards, governance packs, financial data, and risk controls.
Produce five deliverables:
Baseline PMO Effectiveness Index score.
Stakeholder pain-point map.
PMO service catalogue with adoption and outcomes.
Portfolio data-quality assessment.
Three prioritized improvement cases with measurable benefits.
Choose improvement cases with visible executive relevance. Examples include reducing reporting preparation from three days to four hours, shortening decision lead time from 18 days to five, increasing benefit-owner coverage from 45% to 90%, or resolving the ten oldest portfolio dependencies.
Days 31–60: Fix the decision system
Standardize definitions for project status, schedule tolerance, financial forecast, risk exposure, benefit, dependency, and completion. Assign one accountable owner to each data field. Establish a single status date and documented cut-off rules.
Build a concise executive dashboard covering strategic alignment, benefit realization, time-to-value, forecast confidence, capacity, major risks, dependencies, and decision requests. Connect the dashboard with financial-management data, resource allocation, earned value measures, or agile delivery metrics according to the portfolio.
Redesign governance around decision rights:
Define which decisions belong to project managers, sponsors, portfolio boards, finance, procurement, and executives.
Assign a required response time to each decision class.
Require every escalation to include options, consequences, recommendations, and deadlines.
Record decisions and test whether approved actions change the forecast.
Remove standing meetings that produce neither decisions nor risk reduction.
The result should be faster management action rather than a more attractive governance pack.
Days 61–90: Prove value and scale selectively
Measure the improvement against the original baseline. Convert time savings into capacity value, decision improvements into delay avoided, forecast improvements into financial exposure identified, and benefit controls into value protected.
Automate the highest-volume stable processes through project-management integrations, workflow tools, AI-supported reporting, or portfolio platforms. Preserve human review for forecasts, strategic trade-offs, risk interpretation, and executive recommendations.
Create a capability plan covering future project-manager skills, business acumen, portfolio analysis, facilitation, financial literacy, leadership communication, data interpretation, and AI governance. PMI’s findings on business acumen and PM Solutions’ findings on AI reinforce the need to develop technology and human judgment together.
Present the 90-day outcome as an executive value case:
Starting condition.
Intervention completed.
Measured operational change.
Financial or strategic impact.
Remaining exposure.
Next investment required.
Expected return from the next maturity step.
This evidence gives the PMO the authority to expand services selectively. It also protects the organization from funding a broad transformation program before early improvements have demonstrated value.
6. FAQs About PMO Effectiveness
-
PMO effectiveness is the degree to which the office improves strategic alignment, delivery predictability, benefit realization, resource decisions, governance speed, organizational capability, and stakeholder confidence.
An effective PMO links strategy with execution, strengthens portfolio decisions, reduces delivery uncertainty, and produces evidence of value. The number of templates, reports, meetings, or projects supported describes activity rather than impact.
-
The strongest executive measures include benefits realized versus forecast, time-to-value, strategic alignment rate, forecast accuracy, on-time delivery, decision lead time, capacity accuracy, dependency aging, stakeholder confidence, and PMO service adoption.
Operational measures such as schedule variance, risk-action closure, change-cycle time, and reporting effort explain why the executive measures improve or deteriorate.
-
Connect PMO interventions with measurable economic outcomes. Examples include overruns avoided, unviable projects stopped, benefits recovered, reporting hours eliminated, procurement delays prevented, resource conflicts resolved, and earlier delivery of revenue or savings.
Finance should validate material claims. Use consistent project financial terminology, record the counterfactual assumption, and avoid claiming the full project benefit as PMO-created value when other functions contributed.
-
Project performance describes how individual initiatives meet objectives, schedules, budgets, scope, quality, and benefits. PMO performance describes how the office improves the system through governance, prioritization, capability, reporting, assurance, capacity management, and decision support.
A high-performing project may succeed through exceptional individual effort inside a weak delivery system. A strong PMO makes dependable performance repeatable across the portfolio.
-
Operational PMO indicators can be reviewed monthly. Strategic alignment, service performance, benefit realization, stakeholder confidence, and maturity should usually be reviewed quarterly. A full effectiveness assessment can be completed every six or twelve months.
Review frequency should match decision frequency. Risk indicators and critical dependencies may need weekly attention, while capability development and strategic benefits require longer measurement windows.
-
Confidence falls when reports contain stale data, forecasts change late, governance delays decisions, benefits remain invisible, and the PMO enforces processes without demonstrating their value.
Trust improves through transparent definitions, traceable evidence, concise executive reporting, commercially informed recommendations, and visible action on recurring pain points.
