
Essential Agile Metrics Every Project Manager Should Know
Project managers get punished when they track activity instead of signal. Agile teams can look busy, fill boards, close tickets, and still miss delivery dates, burn out engineers, frustrate stakeholders, and ship weak outcomes.
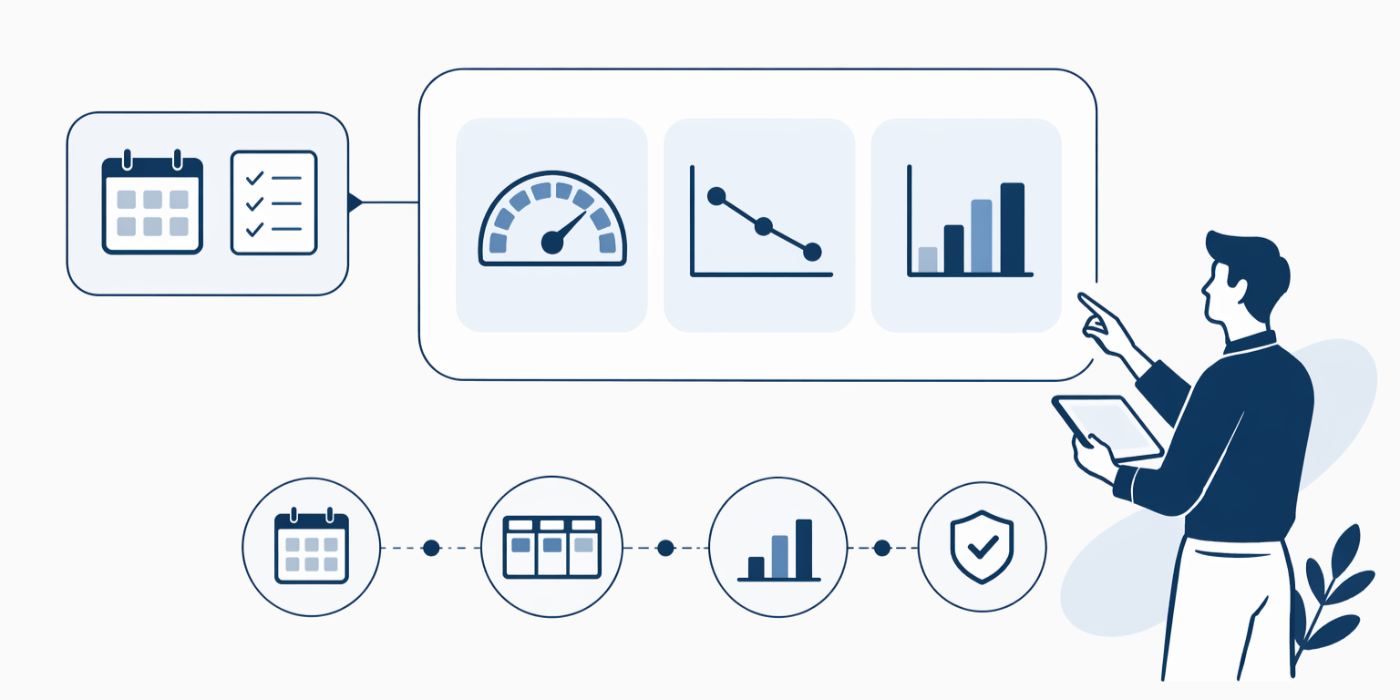
That is why agile metrics matter. The right ones expose flow, quality, predictability, planning discipline, and decision speed before a project turns expensive. This guide breaks down the agile metrics that actually help a project manager lead better conversations, catch delivery risk early, and improve execution without creating dashboard theater.
1. Velocity Is Useful Only When You Read It With Restraint
Velocity is one of the first agile metrics most teams learn, and one of the first they misuse. In plain terms, velocity is the amount of work a team completes in a sprint, usually measured in story points. It helps with short-range planning, release forecasting, and expectation setting. It becomes dangerous when leadership treats it like a productivity score.
A smart project manager uses velocity to detect stability, not to compare teams. Team A completing 40 story points and Team B completing 28 tells you almost nothing. Estimation scales differ, team composition differs, technical debt differs, and domain complexity differs. A healthcare team handling compliance-heavy work will not behave like a product growth team running small UI experiments. That is why broader planning judgment still matters, especially when paired with strong foundations in project scheduling terms, critical path method terms, stakeholder terms, and project communication techniques.
Velocity becomes valuable when you ask sharper questions. Has it stayed within a reasonable band across the last five sprints? Did it drop after new engineers joined? Did it spike because stories were broken down differently? Did unfinished work roll forward and inflate next sprint planning? Those questions turn velocity from vanity into planning intelligence.
The strongest use of velocity is capacity calibration. When a team consistently completes 32 to 36 points, planning 52 points is not optimism. It is denial dressed up as ambition. That pattern should trigger a conversation about scope control, dependency management, skill bottlenecks, and whether the backlog is being refined well enough. Teams that struggle here often also struggle with upstream basics covered in project initiation terms, top project management terms, resource planning tools, and issue tracking software.
Velocity should never become a weapon. The minute teams feel judged by it, they start gaming estimates, inflating points, and avoiding hard work that threatens the number. Then the metric stops measuring delivery and starts measuring political survival.
| Metric | What It Measures | Healthy Signal | Red Flag | Best PM Action |
|---|---|---|---|---|
| Velocity | Completed work per sprint | Stable trend band across several sprints | Wild swings caused by poor slicing or carryover | Revisit sprint planning and story sizing |
| Sprint Burndown | Remaining work through the sprint | Gradual burn with minor variation | Flat line until final days | Check daily execution and blocked work |
| Release Burndown | Progress toward release scope | Scope and completion moving predictably | Completion improves while scope keeps growing | Control additions and re-baseline expectations |
| Cycle Time | Time from work start to completion | Short and consistent completion windows | Aging items sit in progress too long | Find workflow friction and review queue delays |
| Lead Time | Time from request to delivery | Customer request moves to done quickly | Long waiting before work even starts | Inspect intake, prioritization, and dependencies |
| Throughput | Number of items finished in a period | Consistent item completion rate | Many starts, few finishes | Reduce WIP and simplify handoffs |
| Work In Progress | Items being worked on at once | Controlled in-progress inventory | Teams juggling too many tasks | Set or enforce WIP limits |
| Escaped Defects | Defects found after release | Low production defect leakage | Frequent hotfixes after deployment | Strengthen testing and acceptance criteria |
| Defect Density | Defects relative to delivered work | Quality holds as output increases | More work shipped with rising bugs | Investigate rushed development or weak QA |
| Sprint Predictability | Planned vs completed work | Most committed work finishes | Carryover becomes routine | Tighten planning and dependency checks |
| Commitment Reliability | Accuracy of sprint commitments | Commitments reflect real capacity | Chronic overcommitment | Adjust planning discipline and stakeholder pressure |
| Blocked Time | How long work remains blocked | Blockers resolved fast | Items stall for days | Escalate dependency owners early |
| Flow Efficiency | Active work time vs waiting time | Low idle time inside workflow | Most elapsed time is queue time | Reduce approvals and handoff lag |
| Aging Work Items | How long open items remain unfinished | Oldest items still moving | Zombie tickets stay open indefinitely | Review stalled work every stand-up |
| Capacity Utilization | Planned load against true team capacity | Load fits available people and time | Hidden overload despite “green” status | Account for leave, meetings, and support work |
| Scope Change Rate | How often planned scope shifts | Managed and visible changes | Sprint goals constantly rewritten | Protect sprint focus and approval discipline |
| Dependency Resolution Time | Speed of cross-team unblock | External needs resolved quickly | Other teams become silent bottlenecks | Create ownership and escalation rules |
| Reopen Rate | Completed items reopened later | Done usually stays done | Frequent rework after review or test | Check acceptance clarity and quality gates |
| Deployment Frequency | How often usable increments ship | Regular release rhythm | Large risky batch releases | Push smaller increments and cleaner release flow |
| Customer Outcome Signal | Whether delivered work changes target behavior | Released work ties to real result | Features ship without measurable impact | Reconnect backlog to business value |
| Team Happiness Trend | Team morale over time | Pressure remains sustainable | Throughput rises while morale collapses | Address workload and process stress fast |
| Review Turnaround | Speed of review and approval cycles | Fast, steady review movement | Work piles up awaiting sign-off | Fix reviewer load and queue rules |
| Test Pass Stability | Reliability of validation process | Stable test outcomes | Flaky test suites erode trust | Improve automation credibility |
| Planned vs Unplanned Work | Interruptions entering the sprint | Most capacity serves planned goals | Firefighting consumes sprint | Reserve buffer and classify interrupt demand |
| Business Value Delivery | Completion of highest-value items first | Critical items move early | Low-value work crowds the sprint | Re-rank backlog based on impact |
| Estimation Accuracy Trend | Whether estimates improve over time | Better forecasting from sprint to sprint | Persistent sizing noise | Use retrospectives to refine sizing rules |
| Stakeholder Response Time | Decision latency from business owners | Questions answered quickly | Waiting on approvals stalls delivery | Set decision SLAs and escalation paths |
| Technical Debt Load | Deferred quality and maintenance burden | Debt visible and managed | Delivery slows under hidden rework | Protect debt reduction capacity every sprint |
2. Flow Metrics Tell You Where Delivery Is Actually Breaking
If velocity tells you how much finished, flow metrics tell you how work moves. For a project manager, flow metrics are often more revealing than sprint totals. They expose where work gets trapped, how long it waits, and whether the team has a finishing problem disguised as a workload problem.
Start with cycle time. This measures how long it takes for a work item to move from active work to done. When cycle time grows, something inside the system is slowing down. That could be overloaded reviewers, vague acceptance criteria, repeated QA bounce-backs, external approvals, or unresolved dependencies. Teams drowning in delays often need a closer look at issue tracking practices, document management software, knowledge management software, and automation tools for efficiency.
Lead time goes wider. It measures how long it takes from request to delivery. That matters because business stakeholders do not care when engineering starts. They care when they asked and when value arrived. If lead time is bloated while cycle time looks acceptable, your intake, prioritization, or approval system is the real problem. That usually points back to weaker communication structures, stakeholder alignment, procurement definitions, or contract management terminology.
Then there is throughput, which simply measures how many items finish in a given period. Throughput is powerful because it avoids some of the distortion of story points. A team that finishes work steadily is easier to forecast than one that starts everything and finishes late. Pair throughput with work in progress. High WIP plus weak throughput is a classic signal that the team is multitasking itself into slow motion.
A project manager who watches flow can intervene earlier. Instead of discovering at sprint review that half the work spilled over, you can spot the queue forming mid-sprint. You can see reviews backing up, blockers aging, and priorities colliding. That is real control. It is also why strong PMs increasingly rely on dashboard and data visualization tools, project reporting and analytics software, calendar and scheduling tools, and Gantt software where hybrid planning is needed.
3. Predictability Metrics Separate Mature Agile Teams From Hope-Driven Ones
A team can sound confident in sprint planning and still be deeply unreliable. Predictability metrics help you measure whether commitments are realistic, whether priorities stay stable, and whether the team can be trusted to finish what it says it will finish.
Sprint predictability is the clearest starting point. Compare what the team committed to at sprint planning with what it actually completed by sprint end. One weak sprint is normal. Persistent carryover is not. When teams repeatedly miss commitments, the issue usually sits in one of four places: overcommitment, poor estimation, hidden dependency risk, or constant scope intrusion. Each one requires a different fix. Treating them as the same problem leads to lazy leadership.
Commitment reliability sharpens that analysis. Some teams miss targets because they are forced into mid-sprint support work. Others miss because leaders push extra scope into the sprint after kickoff. Others miss because stories were too large and ambiguous from the beginning. Mature project managers diagnose which failure pattern is recurring, then fix the system around it. That means using stronger backlog hygiene, cleaner dependency mapping, better sprint protection, and more disciplined prioritization. Helpful supporting frameworks often come from essential scrum roles and responsibilities, quality management terms, budgeting discipline, and cost management terms.
Blocked time belongs in this conversation too. If a ticket spends three days waiting on another team, that is not merely a delivery inconvenience. It is a forecasting distortion. Your sprint commitment was never real if it depended on someone who was never actually ready. The same applies to review turnaround and stakeholder decision latency. Work that sits waiting still consumes calendar time, burns delivery confidence, and makes future commitments noisier.
Predictability is not about making teams robotic. It is about making promises honest. When stakeholders stop trusting sprint plans, every conversation gets heavier. They ask for extra status meetings. They demand defensive reporting. They escalate faster. They bypass the team to protect themselves. That trust breakdown creates administrative drag that slows delivery even more.
4. Quality Metrics Protect You From “Done” That Is Not Actually Done
Many agile teams move fast right into avoidable rework. Boards look healthy, sprints close, demos happen, and then production defects, reopened tickets, and emergency fixes reveal that the team has been shipping unfinished certainty. Quality metrics protect project managers from mistaking completed workflow steps for dependable delivery.
Escaped defects are one of the most painful signals to ignore. When bugs are found after release, the cost is bigger than a fix ticket. Confidence drops. Support teams take heat. Stakeholders question the process. Engineers get dragged back into yesterday’s work while today’s sprint erodes. A rising escaped defect pattern usually means testing is weak, acceptance criteria are vague, release pressure is too high, or technical debt is being deferred past its safe limit. To reduce that risk, many teams benefit from stronger project quality management terminology, Six Sigma concepts, risk management language, and risk identification terms.
Reopen rate is another brutally honest metric. If completed items frequently reopen, your definition of done is weak or your reviews are too shallow. That can come from rushed QA, loose refinement, unclear business rules, or teams that close tickets before validation truly ends. None of those problems are solved by asking people to “be more careful.” They are solved by process clarity.
Defect density helps you monitor whether quality is holding as volume rises. A team pushing more output with stable quality is scaling well. A team pushing more output with climbing defects is trading future pain for present optics.
Project managers should also watch the ratio of planned to unplanned work. When production issues keep hijacking sprint capacity, that is a quality metric even if it shows up as delivery variance. It means the backlog is competing with the consequences of earlier shortcuts. That tension is easier to manage when teams use stronger project management software, mobile apps for on-the-go PMs, collaboration apps for project teams, and productivity software for busy project managers.
Quality metrics matter because executives rarely forgive the same preventable problem twice. One failed release becomes “lessons learned.” Three similar failures become a credibility problem attached to the PM, the team lead, and the delivery model itself.

5. Outcome and Governance Metrics Keep Agile From Becoming Performative
Agile teams can become very efficient at moving work that should not have been prioritized in the first place. That is where outcome and governance metrics matter. They connect sprint execution to business consequence, decision quality, and organizational trust.
Business value delivery should sit near the top of your metric hierarchy. Ask a hard question: are the highest-impact items moving first, or is the team spending capacity on safer, smaller, politically easier work? Many project environments look healthy on paper while the real business pain remains untouched. A project manager has to keep the backlog tied to revenue risk, customer pain, compliance exposure, service stability, or strategic deadlines. Otherwise agile becomes a ritual system that optimizes motion.
Scope change rate is another governance-level signal. Some scope change is healthy. Constant ungoverned scope change destroys sprint integrity, weakens predictability, and spreads accountability so thin that nobody owns the failure. This is where agile still needs structured project discipline, including the kinds of controls covered in project procurement terms, contract management terminology, human resource management terms in PM, and team building terminology.
Stakeholder response time is often underestimated. When product owners, executives, compliance reviewers, or business leads take too long to make decisions, agile slows even if the delivery team is ready. A smart PM tracks that delay openly. Otherwise the team absorbs blame for waiting it did not create.
Then there is team health. Burnout is not a soft metric when it starts driving defect leakage, turnover risk, slower reviews, weaker stand-ups, and lower estimation quality. Sustainable pace protects quality and predictability together.
At a broader level, project managers who want their agile measurement system to mature should compare internal patterns against larger market shifts in agile industry trends, methodology adoption data, AI and automation adoption in PM, and factors driving project success. Those broader references help you decide whether your team’s pain is local, structural, or part of a wider delivery shift.
The best agile metrics do not create more reporting. They create better intervention. They tell you where to ask tougher questions, where to reduce friction, where to protect quality, and where to stop pretending that output alone equals success.
6. FAQs About Essential Agile Metrics Every Project Manager Should Know
-
There is rarely one metric that deserves total trust on its own, but cycle time is often the strongest starting point because it reveals how smoothly work actually moves through the system. Velocity can hide broken flow. Burndown can hide quality issues. Throughput can hide oversized work items. Cycle time exposes delivery friction quickly, especially when paired with blocked time and work in progress. For PMs managing real deadlines, it often gives earlier warning than sprint-end reporting.
-
Teams estimate differently, work in different domains, carry different technical debt, and face different stakeholder environments. Comparing velocity across teams pushes bad behavior such as point inflation, safer story selection, and political reporting. Velocity works best as an internal planning reference for one stable team over time. It supports forecasting. It should not become a leaderboard.
-
Start with lead time, cycle time, throughput, blocked time, and review turnaround. Those metrics show whether work is waiting too long, whether too much is in progress, and whether dependency or approval queues are damaging flow. If leadership only sees sprint summaries, they often miss the internal friction causing the delay. Flow metrics make that friction visible.
-
Look at the pattern combination. If sprint commitments are missed while escaped defects stay low, you may have a planning, estimation, or dependency issue. If commitments are missed and unplanned bug work keeps entering the sprint, quality is eating capacity. If reopen rate is high, your team may be calling work done too early. Reading metrics in combination matters more than staring at one chart.
-
Executives usually need a smaller set tied to business consequence: sprint predictability, release burndown, lead time, blocked dependency risk, escaped defects, scope change rate, and business value delivery. They need enough visibility to understand delivery confidence without drowning in team-level mechanics. Project managers can keep deeper operational metrics inside delivery reviews while surfacing only the signals that affect decisions, risk, budget, and trust.
-
Some metrics should be read daily or several times a week, especially blocked time, aging work items, WIP, and sprint burndown. Others are better reviewed at sprint close, release checkpoints, or monthly portfolio reviews, such as predictability trends, escaped defects, and business value delivery. The key is matching review frequency to the speed of intervention. Metrics lose value when they are discussed after the window to fix the problem has already passed.