
Understanding Project Reporting: Terms & Best Practices
Project reporting looks harmless until it starts failing. Then it becomes one of the most expensive weaknesses in a project. Teams miss warning signs, executives get polished nonsense instead of usable truth, issues surface too late, and the PM ends up defending a version of reality that no longer exists.
That is why project reporting deserves far more than a glossary-level treatment. The terms matter, but the real value sits in how reports shape decisions, escalation speed, resource confidence, sponsor trust, and recovery options. This guide breaks down the reporting language that matters, shows where bad habits quietly poison visibility, and gives you practical ways to report with enough clarity that leadership can actually act.
1. Why Project Reporting Is a Core Delivery Skill, Not an Admin Task
A weak project plan is dangerous. A weak project report is worse. A poor plan can still be corrected if the team sees reality fast enough. A poor reporting system delays that moment. By the time the truth reaches sponsors, budget damage is already locked, dependencies have already slipped, and the PM is left trying to explain why the dashboard looked calm while the project was drifting. This is why serious reporting belongs alongside project initiation terms, project scheduling terms, project budgeting terms, and the project risk management glossary.
Project reporting is the mechanism that converts delivery activity into decision-ready visibility. It shows what is happening, what changed, what matters now, what is forecast to happen next, and what leadership must decide before the problem gets more expensive. Good reporting reduces noise and raises signal. Bad reporting does the opposite. It hides urgency inside generic updates, confuses movement with progress, and teaches stakeholders to stop reading. That failure pattern is tightly connected to project communication terms and techniques, stakeholder terms, issue tracking software, and project reporting and analytics software.
The strongest PMs understand that reporting is not about documenting effort. It is about compressing complexity without destroying meaning. Stakeholders need the truth at the right altitude. Sponsors need consequence, trend, and choice. Workstream leads need detail, ownership, and timing. Finance needs variance logic. Procurement needs delivery impact. Governance boards need confidence that the project team knows where the pressure points are. The same update cannot serve all of them well. That is why reporting maturity overlaps with dashboard and data visualization tools, document management software, knowledge management software, and calendar and scheduling tools.
There is also a career angle that too many PMs miss. Hiring panels and senior leaders often judge delivery maturity through reporting. A PM who can produce a crisp report that shows trend, dependency strain, risk movement, commercial exposure, and decision needs sounds ready for bigger work. A PM who produces long updates full of status adjectives and no operational clarity sounds junior, even when their project knowledge is decent. That matters for anyone exploring how to become a project manager, from entry-level to executive PM career growth, government project manager careers, and project management director roles.
2. Essential Project Reporting Terms Every PM Should Actually Understand
Status report. A status report is the recurring summary that tells stakeholders where the project stands. In strong environments, it includes health, key changes since last period, upcoming milestones, issues, risks, decisions needed, and forecast shifts. In weak environments, it becomes a bland weekly note that says work is progressing. The difference is huge. A good status report accelerates leadership response. A weak one delays intervention until recovery becomes harder. This term sits at the center of project communication techniques, stakeholder management, project reporting software, and dashboard tools.
Dashboard. A dashboard is the visual layer of reporting. It usually brings together schedule health, budget movement, issue volume, milestone status, risk posture, and action completion into a single view. Dashboards are powerful when they are selective. They are dangerous when they turn into decoration. Too many PMs think a dashboard equals control. It does not. A dashboard is only as honest as its thresholds, data quality, and narrative interpretation. This is why dashboard design should connect with data visualization tools, document management, knowledge management, and project productivity software.
RAG status. Red, amber, and green status codes are meant to simplify health communication. Green means acceptable, amber means concern requiring attention, and red means serious deviation or immediate escalation need. That sounds simple until organizations start using colors politically. Some teams avoid red for reputation reasons. Some use amber as a permanent hiding place. Some mark green while quietly carrying major unresolved dependencies. RAG only works when thresholds are explicit and consistently enforced. That connects directly to project governance trends, project success factors, project failure analysis, and project issue tracking.
KPI. A Key Performance Indicator is a metric chosen because it signals whether a critical aspect of project performance is moving in the right direction. Good project KPIs tie directly to outcomes that matter. Bad project KPIs simply look measurable. Counting meeting attendance, document uploads, or generic task completion may create activity comfort without revealing delivery health. KPIs should help someone make a better decision faster. That is why KPI design belongs beside budget tracking tools, resource allocation software, scheduling tools, and automation tools for PM efficiency.
Variance. Variance is the gap between the approved baseline and current reality. That can be schedule variance, cost variance, effort variance, scope variance, or milestone variance. Reporting variance matters because it exposes whether the project is operating inside control limits or drifting beyond them. Yet many reports mention variance without explaining its cause, likely consequence, or corrective action. That is half-reporting. Strong PMs pair variance with explanation and decision. This logic also strengthens work across project budgeting terms, cost management terms, critical path method terms, and project scheduling glossary.
Forecast. Reporting without forecast is rearview-mirror management. A forecast tells stakeholders what is likely to happen next if current conditions continue. That could mean revised completion dates, budget pressure, workload strain, supplier lag, or dependency slippage. Forecasting is where reporting becomes valuable enough to protect the project rather than merely describe it. It should feel like a control mechanism, not an opinion.
3. Best Practices That Make Project Reports Actually Useful
The first best practice is ruthless relevance. Every line in a report should earn its place. Stakeholders do not need a diary of everything the team touched. They need the things that change confidence, timing, cost, risk, reputation, and decision urgency. The fastest way to kill stakeholder attention is to bury real signal under ceremonial update language. Good PMs filter aggressively. They surface the material. They cut vanity detail. That reporting discipline belongs with project communication techniques, stakeholder terms, issue tracking software, and project reporting analytics.
The second best practice is trend visibility. A static update is rarely enough. Stakeholders need to know whether the project is stabilizing, deteriorating, or entering a recovery path. One amber week means little without context. Three amber weeks with rising issue age and delayed approvals means something very different. Trend lines, repeated metrics, and comparison against baseline matter because they reveal direction. That is why reporting works best when integrated with dashboard tools, Gantt chart software, calendar tools, and project scheduling best practices.
The third best practice is threshold discipline. If schedule slippage of five days turns amber in one month and remains green the next month because the PM is trying to reduce executive anxiety, the report stops being a control instrument. Once stakeholders suspect that colors are negotiable, reporting trust starts dying. Thresholds should be agreed early, documented, and applied consistently. This becomes even more important in environments discussed in future project governance, AI and automation adoption in PM, effectiveness of agile tools, and project success driver analysis.
The fourth best practice is audience tailoring. Sponsors should not receive the same report as workstream managers. Sponsors need a sharp view of health, trend, blockers, cost exposure, and required decisions. Workstream leads need more detail on interdependencies, owner actions, and near-term milestones. Finance needs burn logic and forecast validity. Procurement may need supplier exposure and contractual timing. Reporting fails when the PM sends one overloaded file to everyone and hopes each person will somehow extract what matters. That is where thoughtful use of document management software, knowledge management software, project mobile apps, and mobile collaboration tools starts paying off.
The fifth best practice is consequence-based writing. Instead of saying “data migration is delayed,” say what that means. Does it threaten testing start? Does it compress training? Does it create cost pressure? Does it require sponsor intervention with another team? Reports become useful when they connect status to consequence and consequence to action. That is the sentence-level habit that separates operational reporting from decorative reporting.
The fastest reporting improvement usually comes from making consequence and decision need impossible to miss.
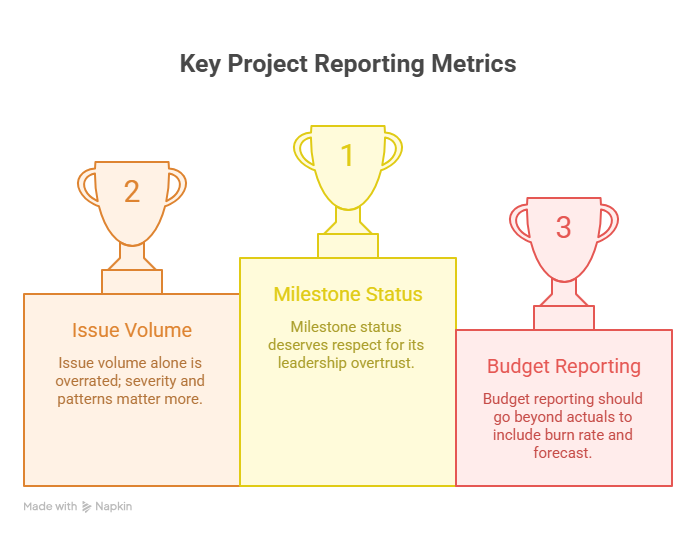
4. Reporting Metrics and Views That Deserve More Respect
Milestone status deserves more respect because leadership often overtrusts it. A project can hit one high-profile milestone while quietly accumulating risk in testing, vendor readiness, or approval queues. Milestone reporting works best when paired with dependency visibility, issue age, and forecast confidence. That broader view becomes stronger when supported by critical path method terms, Gantt chart software, project scheduling tools, and resource allocation solutions.
Issue volume alone is also overrated. Ten minor issues do not always matter more than one severe unresolved blocker. Better reporting shows issue severity, issue age, issue ownership quality, and whether issues are clustering around the same failing control point. That kind of pattern recognition is much more valuable than raw counts. It pairs naturally with issue tracking software, project quality management, risk identification and assessment terms, and project risk glossary.
Budget reporting should also move beyond simple actual-versus-plan snapshots. Smart PMs want to know burn rate, forecast to complete, likely commercial exposure, pending change impact, and where approved scope is being consumed faster than expected. Budget pressure becomes dangerous when it is explained too late or framed too softly. Strong budget reporting reinforces work covered in cost management terms, project budgeting guide, budget tracking tools, and project analytics software.
Finally, narrative commentary deserves more respect because data without interpretation often leaves stakeholders staring at the right numbers and drawing the wrong conclusion. A PM’s commentary should explain what moved, why it moved, why it matters, and what is needed next. That is not fluff. That is leadership.
5. Common Reporting Mistakes That Quietly Damage Projects
The first common mistake is reporting activity as progress. Teams list workshops held, documents produced, meetings completed, and tasks updated, then assume stakeholders can infer whether those things actually moved the project closer to the outcome. They usually cannot. Activity matters only when it changes readiness, reduces risk, unlocks dependencies, or advances delivery. This mistake shows up everywhere from project initiation to agile tool effectiveness to future PM software trends.
The second mistake is writing reports that dodge discomfort. Some PMs soften language because they want to appear calm, capable, and under control. That instinct is understandable and costly. A project does not become safer because the wording became gentler. Reporting should reduce surprise, not preserve appearances. Leaders can handle bad news far better than late news.
The third mistake is using one reporting cadence for every situation. Fast-moving, high-risk projects may need flash reporting, twice-weekly dashboard refreshes, or live issue escalation. Stable low-volatility work may only need weekly or biweekly rhythm. Cadence should follow project volatility, governance expectations, and decision speed requirements. This connects strongly with future of remote project management, project methodology adoption, rise of hybrid project management, and future PM skills by 2030.
The fourth mistake is failing to protect data source integrity. If manual trackers are stale, if task owners are updating late, if financial data is out of sync, or if milestone completion is declared before evidence exists, the reporting layer becomes fragile. Once trust in the source is damaged, every dashboard and summary starts feeling suspect.
The fifth mistake is forgetting that reports are part of governance memory. When decisions, threshold changes, or major assumptions are not captured properly, the team loses its own history. Months later, nobody remembers why a timeline moved, why a tolerance changed, or who approved a compromise. That creates friction during audits, reviews, disputes, and recovery work.
6. FAQs About Project Reporting Terms and Best Practices
-
A status report usually combines narrative explanation with metrics, actions, risks, and decisions. A dashboard is the visual summary layer showing selected indicators quickly. The strongest reporting systems use both. The dashboard shows where attention should go, and the status report explains what the indicators mean.
-
The right cadence depends on project pace, risk profile, stakeholder expectations, and governance structure. High-volatility projects often need more frequent updates than stable operational projects. A weekly cadence is common, but flash reports may be needed when serious deviations emerge between formal cycles.
-
A good project report should show overall health, major changes since the last update, current risks and issues, milestone movement, forecast implications, actions in progress, and any decision or escalation needed from leadership. If the report does not help someone decide, intervene, or realign, it is underperforming.
-
Trust usually drops when reports feel too optimistic, thresholds keep shifting, dashboards contradict lived reality, or important bad news appears late. Stakeholders also lose trust when the same issues repeat for weeks without visible action or consequence framing.
Q5. Is RAG status enough on its own?
RAG status is useful as a signal, but it is too thin on its own. Stakeholders need the explanation behind the color, what changed, what happens next if nothing changes, and what action is required. A red or amber label without that context creates anxiety instead of control.
Q6. What is the biggest mistake PMs make in executive reporting?
The biggest mistake is sending too much information without clarifying what matters most. Executives do not need every detail. They need the truth about health, movement, consequence, and decision requirement. The job is not to prove that work is happening. The job is to make leadership response easier.
Q7. How can a PM make reports more useful immediately?
Start by rewriting narrative commentary in a simple structure: what changed, why it matters, what happens if nothing changes, and what is needed now. That one shift usually improves reporting quality faster than redesigning the whole template.
-
RAG status is useful as a signal, but it is too thin on its own. Stakeholders need the explanation behind the color, what changed, what happens next if nothing changes, and what action is required. A red or amber label without that context creates anxiety instead of control.
-
The biggest mistake is sending too much information without clarifying what matters most. Executives do not need every detail. They need the truth about health, movement, consequence, and decision requirement. The job is not to prove that work is happening. The job is to make leadership response easier.
-
Start by rewriting narrative commentary in a simple structure: what changed, why it matters, what happens if nothing changes, and what is needed now. That one shift usually improves reporting quality faster than redesigning the whole template.