
AI Adoption in Project Management Reaches Record Levels: Industry Trends & Insights (2025)
AI is no longer a side experiment in PMOs—it’s the operating layer. In 2025, leaders are using it to collapse estimation error, shorten change cycles, and make status reports evidence-based instead of opinion. What changed: usable models in every tool you already run, verifiable metrics tied to earned-value, and governance patterns that keep auditors, security, and legal calm. This guide shows where AI is winning now, how to deploy it without “pilot purgatory,” and what skills raise your market value. You’ll see precise playbooks, KPIs, and links into APMIC’s reference libraries for risk, schedule, procurement, and certification readiness.
1) Why AI adoption spiked in 2025 (and what it really changes)
Multiparty delivery is normal; context is fractured. AI turns fragmented artifacts—tickets, SOWs, emails, tests—into a consistent knowledge graph. You can anchor its outputs to concepts in Top 100 PM Terms, then drive risk comms using the Risk Glossary and schedule integrity with CPM terms.
Models moved inside everyday tools. Jira, ServiceNow, CLM, resource planning, and cost systems now ship with embedded AI. Pair them with APMIC’s roundups—Issue Tracking Software, Resource Allocation Tools, and Small-Business PM Software—to avoid vendor theater.
Executives finally see the math. Gains show up as forecast accuracy, cycle-time compression, DSO improvement, and remediation hours avoided. Anchor cost/benefit language in Cost Management terms and connect to stakeholder expectations with Communication techniques.
Hard PM pains now solvable: sandbagged estimates, subjective risk reporting, noisy scope changes, stalled decisions, and audit-unfriendly documentation. When adoption sticks, teams standardize definitions (see Initiation terms) and bake acceptance into verifiable tests (see Quality terms).
2) From pilot to production: governance patterns that keep adoption sticky
Pattern 1: Decision-quality loop.
Feed AI with structured definitions (RACI, deliverables, acceptance), not freeform prose. Start by aligning vocabulary using Initiation terms, lock acceptance gates to Quality definitions, and synchronize cadence with Communication techniques. The loop: data → AI insight → PM decision → result → model feedback.
Pattern 2: Evidence-backed change control.
CRs become small “packets” with schedule, cost, risk deltas auto-computed from the live plan. You’ll present impacts with CPM and Cost Management language that executives already understand.
Pattern 3: AI inside procurement, not bolted on.
Use your CLM to flag clause risks, compare SOWs, and simulate penalties. Tie terminology to Contract Management and sourcing discipline to Procurement terms. Require vendors to show working connectors to your tools from APMIC’s software lists: CLM software and Issue Tracking.
Pattern 4: Data retention and auditability by design.
Version datasets and models; preserve prompts, training dates, and governance decisions. When auditors arrive, you reference Risk taxonomy and “definition of done” from Quality terms to prove control.
Pattern 5: Human-in-the-loop checkpoints.
Don’t ship autonomous decisions for legal/contractual changes. Require two-stage approvals and annotatable AI rationales. This mirrors safety nets you already apply in Scheduling and stakeholder comms via Communication techniques.
3) Case studies & ROI math your CFO won’t ignore
Case A — Telecom: schedule risk + cutover reliability
A national operator ingested 40K tickets, legacy network diagrams, and change windows. AI mapped dependencies and produced a cutover “no-go” list daily. Result: failed cutovers down 33%, rollbacks down 37%, average outage (P1) minutes down 22%. Express this using Scheduling terminology and track residual risk with the Risk Glossary.
Case B — Med-tech: automated validation evidence
AI converted test logs and requirements into FDA-ready packages. Audit prep time fell 46%; non-conformance findings fell 29%. The acceptance criteria were formalized through Quality terms and defects triaged with patterns from Issue Tracking Software.
Case C — Banking: change impact + clause risks
CLM + PM stack flagged risky indemnity and liquidated damages clauses; AI simulated schedule-risk costs on each CR. Renegotiations eliminated two penalty traps; EV-based forecasts improved 14%. Ground your playbook in Contract Management, CPM terms, and Cost Management.
Reusable ROI equation
Forecast error reduction: (baseline MAPE − AI MAPE) × portfolio budget.
Cycle-time compression: Δ lead time × blended daily burn.
Defect escape avoidance: avoided incidents × average incident cost.
Audit readiness: saved hours × external audit rate.
Penalty avoidance: avoided SLA/contract penalties × historical frequency.
Present this with APMIC’s salary/market context from the Global Salary Report to highlight competitive stakes.
What’s your biggest blocker to scaling AI in delivery?
4) Implementation playbooks (people, process, data, tech)
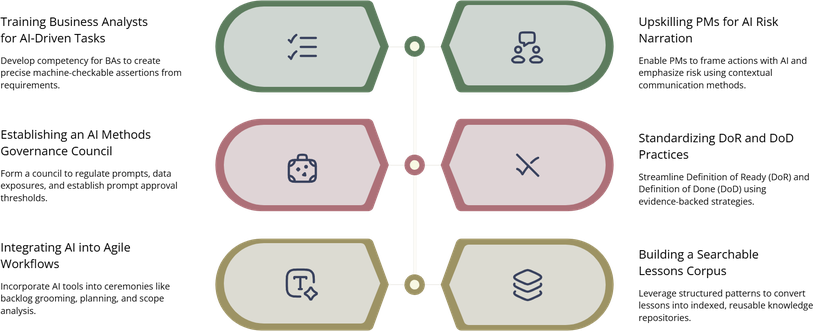
People
Train BAs to convert requirements into machine-checkable assertions; adapt language from Quality terms.
Upskill PMs on AI-assisted risk narration using the Risk Glossary and stakeholder-specific summaries via Communication techniques.
Build a “methods council” that governs prompts, approval thresholds, and data exposure—mirror the gate reviews you know from Initiation terms.
Process
Standardize DoR/DoD; teach teams to attach evidence. Align with CPM & scheduling so AI predictions map to real float, not wishful thinking.
Bake AI into ceremonies: backlog grooming (dedupe, scope), planning (risk), and review (acceptance packs).
Convert lessons learned into a searchable corpus using patterns from Top 100 PM Terms.
Data
Define canonical schemas for requirements, risks, issues, costs; version everything.
Keep sensitive artifacts in your DMS; store hashes and metadata in your PM stack. Align retention with Contract Management and risk with the Risk Glossary.
Tech
Prioritize platforms with first-party connectors (Jira/ServiceNow/CLM/ERP). Use APMIC’s roundups—Resource Tools, Issue Trackers—and complement with agile credentials like PMI-ACP Q&A.
Controls
Human-in-the-loop for contractual/financial changes.
Prompt libraries with versioning and owners.
Bias/quality checks on generated summaries; evidence links must be clickable back to the source record.
Explainability: if an estimate changes, show which historical analogs drove it.
5) Skills, tooling, and career impact for PMs in 2025
What to master now
Structured acceptance criteria (assertions + tests) — revisit Quality terms.
Risk narration rooted in data — use Risk Glossary.
Schedule realism — tie AI predictions to CPM and buffers from Scheduling terminology.
Procurement literacy — read Procurement terms and CLM software so you can negotiate verifiable SLAs.
Agile fluency — pair AI with ceremonies; leverage Essential Scrum Roles and certification paths like PMI-ACP 30-day.
Tooling stack
A PMOS (project management operating system) that centralizes work, connectors, and AI features.
A governed data lake for tickets, tests, and logs.
CLM with AI clause analysis, and issue tracking with AI triage.
Cross-shop with APMIC’s software guides—Small-Business PM Software, Issue Tracking, and Resource Allocation.
Career upside
PMs who can design AI-augmented governance and explain the ROI out-earn peers. Validate your path with Project Manager Salary Comparison (PMP vs PRINCE2 vs CAPM) and the Global Salary Report. If you’re choosing credentials, compare CAPM vs PMP and broaden with CompTIA Project+ or leadership-heavy CPD.
6) FAQs — direct answers PMOs ask about AI adoption
-
Begin at one decision point (e.g., change approval). Define the minimum fields, clean only that slice, and connect AI to produce an executive-ready impact summary. Expand outward. Use shared vocabulary from Initiation terms, present deltas with Cost Management, and tie to schedule realism via CPM.
-
Require evidence links for every generated statement. If a risk is flagged, the report must link to the ticket/test/log. Establish a “no-evidence, no-publish” rule. Align controls with Communication techniques and audit defensibility via the Risk Glossary.
-
Both. Generative AI improves throughput (summaries, drafts). Predictive models improve outcomes (dates, costs, risk). Most PMOs use generative at first, then add prediction once data quality rises. Use Scheduling terms and Cost terminology to communicate benefits.
-
Keep sensitive artifacts in your DMS; log only metadata in the PM tool. Redact PII, run private models where required, and insist on exportable state from vendors. Map responsibilities using Contract Management terms and capture residual risk in the Risk Glossary.
-
Choose a process with measurable friction: change approvals, acceptance reporting, or audit packaging. Track Δ forecast accuracy, Δ lead time, and Δ disputes. Express the math using Cost Management and schedule realism via CPM.
-
No—AI scales judgment; it doesn’t own it. PMs orchestrate trade-offs between cost, time, scope, and risk, and decide what “good” looks like. Strengthen those muscles with Essential Scrum Roles and certifications like CAPM vs PMP.