
Complete Guide to Earned Value Management (EVM) Terms
Earned Value Management becomes intimidating when teams treat it like a formula test instead of a control system. The terms sound technical, the acronyms pile up fast, and many project managers end up memorizing definitions without learning what those definitions are supposed to protect.
That gap is expensive. EVM exists to show whether work is progressing at the value level, not just at the activity level. When you understand the core terms properly, you can spot budget drift, schedule weakness, weak forecasting, and reporting theater far earlier. This guide breaks down the EVM language that actually helps project managers make sharper decisions under pressure.

1. The Core Logic of Earned Value Management Starts With Three Numbers
Every strong EVM conversation starts with three anchor terms: Planned Value, Earned Value, and Actual Cost. If these are fuzzy, everything built on top of them becomes noisy, misleading, or flat-out useless.
Planned Value (PV) is the approved budget for the work that should have been completed by a certain date. It answers one simple question: how much value were we supposed to have delivered by now? That makes PV a time-phased baseline concept, which is why it links naturally to stronger planning fundamentals such as project scheduling terms, critical path method terminology, project budgeting terms, and cost management terms for project managers.
Earned Value (EV) is the budgeted value of the work actually completed. That word “budgeted” matters. EV does not measure what you spent. It measures how much authorized value you have truly earned by finishing approved scope. A team can burn a lot of money and still earn very little value if progress is weak, quality is poor, or milestones are being overstated.
Actual Cost (AC) is what the project has actually spent for the work performed. This seems straightforward until reporting becomes sloppy. If labor capture is delayed, vendor costs arrive late, procurement timing is unclear, or shared services are booked inconsistently, AC becomes less reliable than leadership assumes. That is why sound EVM depends on better control over procurement terminology, contract management terminology, project reporting software, and document management systems.
These three terms form the basic EVM triangle. PV tells you what should have happened. EV tells you what value you have truly earned. AC tells you what it cost to get there. When one of them rises while the others lag, the project story changes fast. That is why EVM is so powerful. It forces progress, time, and spend into one conversation instead of letting teams hide behind partial reporting.
A project can look “busy” in status meetings and still be in trouble. Tasks can be underway, teams can be active, vendors can be invoicing, and stakeholders can be hearing upbeat language. If EV is weak relative to PV and AC, the project is not healthy. It is simply consuming energy without converting enough of that effort into approved value.
| Term | Meaning | Why It Matters | What a Bad Signal Looks Like | Best PM Response |
|---|---|---|---|---|
| Planned Value (PV) | Budgeted value of work scheduled by a date | Shows where the project should be | Baseline is vague or outdated | Recheck schedule logic and approved baseline |
| Earned Value (EV) | Budgeted value of completed work | Shows true progress in value terms | Progress is overstated without completion proof | Tighten completion criteria |
| Actual Cost (AC) | Real cost incurred for performed work | Reveals spend against achievement | Costs arrive late or inconsistently coded | Strengthen cost capture discipline |
| Budget at Completion (BAC) | Total approved budget for the project | Acts as the top-line cost baseline | Budget changes without controlled approval | Protect formal change control |
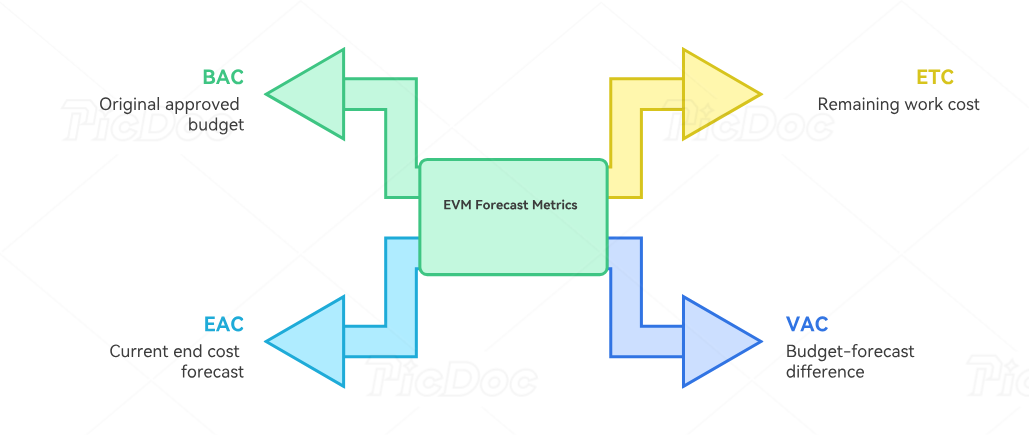
| Estimate at Completion (EAC) | Forecasted total cost at project finish | Shows where total spend is heading | Forecast stays static while variance worsens | Reforecast honestly using current performance |
| Estimate to Complete (ETC) | Expected additional cost to finish remaining work | Supports forward planning | Remaining cost looks unrealistically low | Stress-test assumptions by work package |
| Variance at Completion (VAC) | BAC minus EAC | Shows expected final overrun or underrun | Negative VAC ignored until late | Escalate corrective action early |
| Cost Variance (CV) | EV minus AC | Shows whether earned work cost too much | Negative CV becomes normal | Investigate labor, vendor, and rework drivers |
| Schedule Variance (SV) | EV minus PV | Shows whether earned progress trails plan | Negative SV hidden by task activity | Focus on milestone completion, not motion |
| Cost Performance Index (CPI) | EV divided by AC | Measures cost efficiency | CPI below 1.0 continues for months | Fix cost leakage before forecasting worsens |
| Schedule Performance Index (SPI) | EV divided by PV | Measures schedule efficiency | SPI below 1.0 with no recovery plan | Review logic, dependencies, and resourcing |
| Percent Complete | Share of authorized work completed | Feeds EV calculation | Subjective percentages without evidence | Use measurable completion rules |
| Work Breakdown Structure (WBS) | Hierarchical decomposition of project scope | Creates control-account clarity | Scope too broad for meaningful measurement | Break work into controllable packages |
| Work Package | Lowest planned unit for measurement and control | Where value is often earned and reported | Packages too large to track accurately | Restructure for better visibility |
| Control Account | Management control point combining scope, schedule, and cost | Supports accountability | Ownership is blurred | Assign clear control account responsibility |
| Control Account Manager | Owner responsible for control account performance | Prevents reporting ambiguity | Variances have no accountable owner | Clarify decision rights and escalation path |
| Baseline | Approved plan used for comparison | EVM becomes meaningless without it | Teams measure against moving targets | Lock and govern baselines properly |
| Management Reserve | Budget held for unknown-unknown risk | Provides controlled flexibility | Used casually to hide bad planning | Protect reserve governance |
| Contingency Reserve | Budget for identified known risks | Supports risk-adjusted planning | Risk budgets not tied to actual exposures | Link reserve to risk register logic |
| Milestone Weighting | Value assigned to defined progress points | Improves objectivity in EV | Weights distort real completion value | Align weights to true deliverable significance |
| 0/100 Rule | No value until task is complete | Very strict progress credit method | Long tasks show zero for too long | Use where completion is binary |
| 50/50 Rule | Some value at start, rest at finish | Simple progress method | Inflates progress on weak starts | Use only for short, stable work |
| Physical Percent Complete | Completion based on tangible deliverable status | Grounds EV in actual output | Reported progress exceeds visible evidence | Demand milestone proof |
| Level of Effort (LOE) | Ongoing support work measured by time | Useful for non-discrete support activities | Too much work classified as LOE | Keep LOE from masking real performance |
| Apportioned Effort | Support work tied proportionally to discrete work | Helps track related indirect effort | Applied without a clear driver | Use only with logical parent work |
| Trend Analysis | Review of performance direction over time | Shows whether conditions are improving or worsening | Single-period reporting hides decline | Read patterns, not isolated numbers |
| To-Complete Performance Index (TCPI) | Required future efficiency to hit target budget | Shows how realistic recovery still is | Recovery target becomes mathematically unrealistic | Reset expectations and rebaseline if needed |
2. Variance Terms Show Where Performance Is Already Breaking
Once the three core values are understood, the next level is variance analysis. This is where EVM becomes far more useful than traditional status reporting. Variance terms tell you whether your project is behind, over budget, or both, and they do it in a way that ties performance to baseline expectations rather than personality, excuses, or meeting spin.
Cost Variance (CV) equals EV minus AC. A positive number means you have earned more value than you spent to get it. A negative number means the work completed has cost more than the value earned. This is one of the fastest ways to expose a project that is burning money inefficiently even while progress updates sound upbeat. Teams under cost pressure usually need deeper attention to budget tracking software, project analytics tools, automation tools for PM efficiency, and project management software feature trends.
Schedule Variance (SV) equals EV minus PV. It tells you whether earned progress is ahead of or behind the baseline plan. This term matters because many projects look active while falling behind in value terms. Meetings happen, documents circulate, work is “in progress,” and hours are spent, but the planned value curve still outruns earned value. That gap is where schedule confidence starts to decay.
Variance at Completion (VAC) takes the forecast further forward. It is usually calculated as BAC minus EAC and shows whether the project is expected to finish over or under budget. If VAC is negative, the current outlook points to an overrun. That number gets politically sensitive fast, which is exactly why weak organizations delay confronting it.
Project managers should resist one common mistake here: reading variances as accounting trivia instead of management signals. A negative CV is not just a bad number. It may point to labor inefficiency, poor vendor control, defective scope definition, or expensive rework. A negative SV may reflect dependency delays, unrealistic sequencing, bad approvals, or weak milestone design. Those causes connect naturally with stronger mastery of project initiation terms, risk management glossary language, risk identification terms, and project communication techniques.
Variances tell you where trouble is visible. Good project management starts when you go one level deeper and ask why the variance appeared, why it was not caught sooner, and what control weakness allowed it to keep growing.
3. Performance Index Terms Reveal Efficiency, Forecast Strength, and Recovery Pressure
If variance terms tell you what has already gone wrong, performance indexes tell you how efficiently the project is functioning and how hard recovery will be from here. These ratios are compact, but they carry enormous diagnostic value.
Cost Performance Index (CPI) equals EV divided by AC. A CPI above 1.0 means cost efficiency is favorable. A CPI below 1.0 means the project is earning less value per dollar than planned. This is one of the most important EVM indicators because it helps forecast the likely final cost if current performance continues. A project with a sustained CPI problem rarely fixes itself through optimism.
Schedule Performance Index (SPI) equals EV divided by PV. An SPI above 1.0 suggests the project is earning value faster than planned. Below 1.0 means it is lagging. SPI matters because leaders often confuse effort with schedule health. Teams can work nights, hold more stand-ups, and send more updates while SPI still shows that earned progress is behind.
To-Complete Performance Index (TCPI) is where the conversation gets brutally honest. TCPI shows the efficiency level required on the remaining work to meet a specific budget target, often BAC or EAC. In plain terms, it answers: how hard would we have to perform from this point forward to still hit the desired finish line? If TCPI shoots unrealistically high, the project is no longer in “tighten execution” territory. It is in “reset expectations” territory.
These indexes become far more useful when reviewed as trends rather than isolated values. A one-time CPI dip may not matter much. Four reporting periods of CPI erosion tell a very different story. The same applies to SPI. Trend direction matters because it reveals whether corrective actions are real or cosmetic. That is why mature project teams use dashboard and data visualization tools, knowledge management software, calendar and scheduling tools, and resource allocation tools to support performance monitoring that goes beyond monthly slideshow reporting.
Indexes also force discipline in forecasting. If current CPI and SPI trends are weak, but the forecast suddenly claims a heroic recovery, a project manager should challenge the assumptions hard. What changed structurally? Was scope reduced? Were bottlenecks removed? Was staffing upgraded? Were contracts renegotiated? Recovery without a mechanism is just reporting fiction.
4. Forecasting Terms Matter Because Leadership Lives in the Future, Not the Current Report
Many project teams spend too much time reporting where they are and too little time explaining where they are heading. Forecasting terms in EVM close that gap. They help project managers translate current performance into future cost consequences before the overrun becomes unavoidable.
Budget at Completion (BAC) is the original total approved project budget. It is the anchor against which later forecasts are judged. BAC sounds simple, but it loses value fast if scope changes are poorly controlled or baseline revisions happen without discipline. That is why BAC is only as trustworthy as your project governance habits, stakeholder control structures, contract management foundations, and procurement tools.
Estimate at Completion (EAC) is the current forecast of what the project will cost at the end. This is where EVM becomes strategically useful. EAC forces the project to stop pretending that the original plan is still intact when performance evidence says otherwise. There are several formulas for EAC depending on whether you expect current cost inefficiency to continue, improve, or be offset. The formula choice matters, but the management honesty matters more.
Estimate to Complete (ETC) focuses only on the future work left to do. It tells you how much more money will likely be needed from now to finish. ETC is especially useful in executive conversations because it helps answer the question nobody phrases nicely: what is the remaining damage if we stay the course?
Variance at Completion (VAC) then closes the loop by showing the difference between the original total budget and the current total forecast. Negative VAC puts pressure on decision-making. That is healthy. The danger lies in organizations that treat negative VAC as a communications problem instead of a control problem.
Forecasting terms get stronger when the PM links them to reality on the ground. If EAC is climbing, what is driving it? Labor inefficiency? Vendor inflation? Rework from quality failures? Delayed approvals extending support costs? Weak staffing design? Gaps here often connect to human resource management terminology, team building concepts for PMs, quality management terms, and project issue tracking systems.
Forecasting is not about guessing more confidently. It is about updating the project’s financial truth fast enough that leadership can still do something useful with it.
5. Structural EVM Terms Determine Whether Your Reporting Is Credible or Decorative
A surprising number of EVM failures happen before any formula is applied. They happen in the structural terms and setup decisions that determine whether your cost, schedule, and scope data can be trusted at all. If these terms are weak, the metrics built on them become clean-looking nonsense.
Start with the Work Breakdown Structure (WBS). This is the hierarchical decomposition of project scope into manageable components. A weak WBS creates measurement chaos. If work is too broad, too vague, or poorly grouped, earned value turns subjective. That is why serious EVM depends on disciplined planning foundations similar to those discussed in top project management terms, project initiation terms, project software for small businesses, and software platforms for PM training.
A work package is the lowest practical planning unit where cost, schedule, and scope can be measured. If work packages are too large, progress reporting becomes impressionistic. If they are too tiny, administration explodes and teams drown in low-value tracking. Good structure sits in the middle: detailed enough to measure honestly, lean enough to manage.
A control account is the management control point where scope, budget, and schedule intersect. This is where accountability becomes real. A project without clear control accounts often has the same symptom everywhere: variances exist, but nobody decisively owns them. That is why the Control Account Manager role matters. Reporting without ownership invites drift.
Then there are the progress-crediting methods such as the 0/100 rule, 50/50 rule, milestone weighting, physical percent complete, level of effort, and apportioned effort. These are not technical trivia. They decide how value is claimed. The wrong method can inflate EV, hide delay, or falsely smooth performance. A long technical task using 50/50 can look healthier than it really is. Too much work classified as level of effort can erase the signal that discrete deliverables are slipping. Weak progress rules are one reason leadership sees “green” dashboards right before budget shock lands.
Structural rigor matters because EVM is only as honest as the architecture underneath it. Teams that want stronger capability in this area often benefit from broader professional development through PMP exam preparation resources, CAPM certification guides, PMI-ACP preparation content, and career roadmaps for project managers.
6. FAQs About Earned Value Management Terms
-
Think of EVM as a system that compares what the project planned to achieve, what it has truly achieved, and what it has spent to get there. Planned Value shows where the project should be. Earned Value shows what value has actually been completed. Actual Cost shows what the project paid. Everything else in EVM builds on those three ideas.
-
Planned Value is the budgeted value of work that was supposed to be completed by a certain date. Earned Value is the budgeted value of work actually completed by that date. That difference matters because many projects stay active without earning enough real progress. PV measures expectation. EV measures achievement.
-
Percent complete becomes messy when completion rules are vague. Teams often report progress based on effort spent, optimism, or partial movement rather than objective deliverable status. That makes EV unreliable. Strong EVM requires measurable completion criteria, milestone-based logic, or physical proof of progress rather than subjective updates.
-
A CPI below 1.0 means the project is getting less than one unit of earned value for each unit of cost spent. In practical terms, the project is cost-inefficient. The lower the CPI trend, the more likely the final cost forecast will worsen unless something structural changes in labor productivity, quality, procurement, or rework levels.
-
They can be if the baseline is weak or if earned value credit is too generous. They can also look healthier than reality near the end of some projects because time itself continues while value recognition can flatten. That is why project managers should read schedule indicators alongside milestone completion, dependency status, and critical path exposure.
-
Estimate at Completion is the total expected final project cost. Estimate to Complete is the additional cost expected from now until the project is finished. EAC answers where total cost is heading. ETC answers what it will still take to finish from this point forward.