
Essential Project Quality Management Terms Defined
Project Quality Management (PQM) is more than a compliance requirement—it's the foundation of consistent project outcomes. Whether you're delivering software, infrastructure, or services, mastering PQM terms like VOC, benchmarking, and CoQ equips teams to build quality into every layer of execution.
When project managers know the language of quality, they align faster with stakeholders, avoid costly rework, and preempt delivery risks. These terms are not jargon—they’re operational tools that clarify requirements, track standards, and measure success. From audits to handoffs, using the right terminology creates predictable, scalable, and trust-driven results.

Quality Planning Terms Every PM Must Know
Cost of Quality (CoQ), Voice of the Customer (VOC)
Cost of Quality (CoQ) refers to the total cost incurred to ensure product quality—including both conformance (prevention and appraisal) and non-conformance (failures and rework). High CoQ isn’t inherently bad—low CoQ often signals underinvestment in proactive quality management, which leads to defects downstream.
Voice of the Customer (VOC) captures client expectations, preferences, and pain points through interviews, surveys, or product feedback. VOC should directly influence requirements, KPIs, and quality metrics. Ignoring VOC increases the risk of stakeholder misalignment and product rejection post-delivery.
Together, CoQ and VOC shape how projects define success. They quantify what quality means to the user, and how much it costs to deliver it consistently.
SIPOC Diagrams, Quality Metrics
A SIPOC diagram (Suppliers, Inputs, Process, Outputs, Customers) offers a high-level view of a process before detailed design or improvement begins. It identifies who is involved, what’s needed, how work flows, and where quality risks may emerge. SIPOC is often used early in Six Sigma and Lean projects to align teams before diving into granular analysis.
Quality metrics translate abstract expectations into measurable parameters—such as defect density, uptime percentage, or review cycle time. Without these, quality goals remain vague and untrackable. Every deliverable must tie to clear metrics that quantify performance and compliance. Over time, these metrics enable benchmarking and continuous refinement.
Quality Management Plan, Benchmarking
The Quality Management Plan defines how the project will meet quality requirements. It outlines roles, standards, review cycles, and escalation paths. Without it, quality efforts become fragmented, reactive, and disconnected from project milestones.
Benchmarking compares your processes or outcomes with industry leaders or internal past successes. This external or internal reference point helps set realistic performance targets and exposes performance gaps. Benchmarking shouldn’t just be about performance—it should identify which processes drive top-tier results, and how to adapt them effectively.
| Term | Definition |
|---|---|
| Cost of Quality (CoQ) | Total cost of achieving and failing to achieve quality (prevention, appraisal, failure costs). A low CoQ can indicate poor investment in quality. |
| Voice of the Customer (VOC) | Customer expectations gathered via feedback, surveys, and interviews. Guides quality standards and reduces rejection risk. |
| SIPOC Diagram | High-level process mapping: Suppliers, Inputs, Process, Outputs, Customers. Used early in process improvement. |
| Quality Metrics | Quantifiable measures like defect rate or cycle time that define success and enable tracking. |
| Quality Management Plan | Document that outlines quality procedures, roles, escalation paths, and compliance checkpoints. |
| Benchmarking | Comparing project/process performance with industry leaders or internal bests to identify improvement areas. |
Quality Assurance Vocabulary
Process Audits, Process Improvement
Process audits evaluate whether activities comply with predefined procedures, policies, or standards. Unlike inspections, they don’t assess the product itself—they check if the process was followed correctly. These audits are proactive, surfacing inefficiencies, inconsistencies, or risks before they escalate into delivery failures.
Process improvement is a direct outcome of auditing insights. Techniques like PDCA (Plan-Do-Check-Act), Six Sigma DMAIC, or root cause analysis help refine workflows and remove process waste. High-performing teams don't wait for problems—they use audit data to predict, prevent, and optimize.
The real value lies in making audits less about “compliance policing” and more about operational enhancement. Continuous review feeds improvement, which feeds competitive advantage.
Prevention Over Inspection
The mantra of quality assurance is simple: prevent errors before they happen. Inspection—while necessary—comes after the damage is done. Prevention focuses on upstream controls: checklists, automated testing, training, and standardization.
Inspection can identify failure; prevention eliminates the root cause. A mature PMO spends more resources on robust planning, standard operating procedures, and skill-building than on catching mistakes late.
The key takeaway: the more inspection you rely on, the more flawed your system design is. Zero-defect culture is built on prevention.
Continuous Improvement vs. Continuous Delivery
Continuous improvement (Kaizen) focuses on incremental upgrades to systems, people, and processes. It’s culture-driven and long-term. Continuous delivery, by contrast, is a technical practice that automates product deployment to ensure frequent, reliable releases.
Many confuse the two—but one shapes how work is done, the other shapes how value is delivered. Both matter, but applying them interchangeably creates gaps. A project with rapid delivery but poor improvement culture becomes brittle. One with endless tweaks but no release cycles becomes irrelevant.
True project quality blends both: frequent delivery + structured improvement loops.

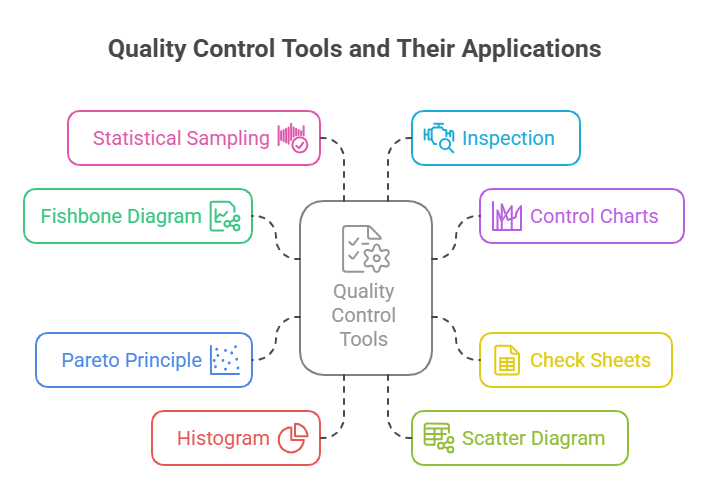
Quality Control Tools and Language
Fishbone Diagram, Control Charts, Check Sheets
The Fishbone Diagram (or Ishikawa Diagram) is a cause-and-effect analysis tool that categorizes potential sources of defects into groups like methods, machines, materials, and manpower. It’s invaluable when you're troubleshooting recurring issues, helping teams look beyond symptoms.
Control charts monitor process behavior over time. They plot data against upper and lower control limits to identify variation. If a process stays within limits, it’s stable—even if it's not perfect. This prevents overreaction to normal process fluctuations and flags true anomalies early.
Check sheets are structured forms used to collect real-time data during operations—ideal for tracking defects or error patterns. When analyzed regularly, they reveal trends that can guide corrective actions and standard operating procedures.
Pareto Principle, Histogram, Scatter Diagram
The Pareto Principle (80/20 rule) in quality control suggests that 80% of defects stem from 20% of causes. Prioritizing these few high-impact causes can reduce most issues with minimal effort. Visualized through Pareto charts, it transforms QC into a strategic task—not just a checklist.
A histogram displays frequency distribution. In quality control, it helps assess whether results are clustering around the mean, skewed, or following a specific pattern. It’s particularly helpful for monitoring batch-level variations and spotting inconsistencies across outputs.
Scatter diagrams plot two variables to reveal correlation—often used in root cause analysis. If defect rates rise with temperature, workload, or operator shift, scatter diagrams visualize that link, enabling proactive adjustments.
Statistical Sampling, Inspection
Statistical sampling reduces effort without compromising accuracy by analyzing a representative subset of outputs. It’s widely used in quality inspections, audits, and process validation. Done right, it maintains control while saving time.
Inspection, on the other hand, is a direct examination of deliverables—either visual, mechanical, or automated. It's used to detect deviation from specs before delivery. While necessary, inspection is reactive. Over-reliance on it signals poor prevention systems.
When combined, statistical sampling ensures that inspection is focused, fast, and meaningful, without overloading the team or the timeline.
Risk, Defect & Error Management Terms
Error, Defect, Bug: Key Differences
Error, defect, and bug are not interchangeable—they pinpoint different stages in the quality failure chain. An error is a human mistake, such as a miscalculation or incorrect code logic. It’s the root action that sets a fault in motion.
A defect is the result of that error—something that doesn’t meet requirements. It could appear in the product, process, or documentation. If the defect occurs in a technical product, it may manifest as a bug—which is a specific defect in code, logic, or user interaction.
Understanding these distinctions is essential for root cause analysis and effective quality control. Addressing a bug may fix the symptom; resolving the error prevents it altogether.
Rework, Change Requests
Rework is the process of correcting deliverables that don’t meet quality standards. It consumes time, labor, and trust. Projects with high rework rates almost always bleed budget and schedule. The key to minimizing rework is catching errors during planning or early testing.
Change requests, on the other hand, are formal asks to modify scope, features, or quality thresholds. They aren’t always tied to defects—they may stem from new stakeholder insights or evolving market conditions. However, uncontrolled or late-stage change requests often induce rework and increase defect probability.
High-performing PMs know the balance: integrate change flexibly without destabilizing quality.
Acceptable Quality Limit (AQL), Control Limits
Acceptable Quality Limit (AQL) is the maximum number of defects allowed in a sample batch before it's rejected. AQL is used in statistical quality control to ensure product batches are reliable enough for distribution. Different industries have different AQL thresholds depending on risk tolerance.
Control limits, by contrast, apply to process metrics in tools like control charts. They define the statistical boundary within which a process is considered stable. Going beyond control limits doesn’t always mean failure—it signals the need to investigate special causes of variation.
AQL tells you when to reject output. Control limits tell you when to investigate process behavior. Using both together strengthens quality defenses.
| Term | Definition |
|---|---|
| Error | A human mistake, such as miscalculating data or writing faulty logic, which initiates a quality failure in a product or process. |
| Defect | A result of an error—something that does not meet specifications or expectations, found in a product, process, or documentation. |
| Bug | A technical defect commonly occurring in software, often caused by logic flaws or code errors that affect user experience or behavior. |
| Rework | The act of fixing deliverables that fail to meet requirements—often labor-intensive, expensive, and avoidable with early interventions. |
| Change Request | A formal request to modify the project scope, requirements, or standards—can be proactive or reactive, not always defect-driven. |
| Acceptable Quality Limit | The maximum number of defects allowed in a sample before it is rejected, ensuring output quality aligns with agreed thresholds. |
| Control Limits | A statistical boundary used in process control charts to identify when variations signal the need for investigation. |
Agile and Lean Quality Vocabulary
Test-Driven Development, Definition of Done (DoD)
Test-Driven Development (TDD) flips the traditional approach: tests are written before the code. Developers create small test cases to define expected behavior, then write code to pass those tests. This promotes modularity, reduces defects, and creates built-in quality from day one.
Definition of Done (DoD) ensures that a deliverable meets all agreed-upon criteria before it's considered complete. This includes coding standards, testing, documentation, and stakeholder approval. A clear DoD prevents ambiguity, reduces rework, and aligns team expectations.
Together, TDD and DoD serve as dual safeguards—one technical, one procedural—that guarantee iterative outputs stay stable, scalable, and validated.
Kaizen, Poka-Yoke, Muda, Jidoka
Kaizen is the philosophy of continuous, incremental improvement. It's not a sprint—it’s an embedded mindset that encourages all team members to suggest ways to eliminate waste and improve processes.
Poka-Yoke means “mistake-proofing.” It's about designing processes or tools that make errors impossible or immediately detectable. Think: color-coded cables, alert flags, or input validations.
Muda refers to non-value-adding activities—anything that consumes time, resources, or attention without improving the final product. Identifying Muda is the first step in Lean optimization.
Jidoka, or “autonomation,” allows machines or processes to stop automatically when an error is detected. This prevents defects from progressing down the line, ensuring built-in quality at each step.
These four terms form a foundational toolkit in Lean project environments—focused not just on speed, but intelligent, sustainable excellence.
Minimum Viable Product (MVP)
The Minimum Viable Product (MVP) is a lean version of a product with just enough features to gather validated feedback from early users. The goal isn’t perfection—it’s real-world learning. MVPs reduce time to market, test hypotheses, and save resources on features customers don’t want.
MVPs are not low-quality products. They are focused, functional, and strategically scoped. When tied to Agile sprints and Lean loops, they allow teams to pivot faster and refine the product in response to actual data—not assumptions.
Used well, MVPs accelerate product-market fit and keep quality agile—not bloated.

Learn Quality Management in Our PM Course
Quality isn’t a buzzword—it’s a system. And mastering that system is what our Advanced Project Management Certification delivers through targeted training in QMS frameworks, Lean Six Sigma, Agile testing cycles, and real-world risk mitigation.
This course dives deep into:
Quality Management Systems (QMS)
You’ll learn how ISO-compliant QMS frameworks structure documentation, audits, stakeholder accountability, and defect control across industries. The modules go beyond theory—showing how to implement QMS protocols within real project environments.
It’s not about compliance for compliance’s sake—it’s about creating scalable, repeatable, and resilient delivery cycles.
Lean Six Sigma Integration
Our training breaks down DMAIC, SIPOC, and value stream mapping, equipping PMs to root out inefficiencies, design preventive controls, and lead data-driven process improvements. Whether you're in manufacturing, IT, or service delivery, you’ll know how to reduce Muda and maximize quality yield.
Lean Six Sigma isn't just for black belts—it’s for anyone managing teams, workflows, or stakeholder expectations.
Agile Quality Tracking
Agile quality isn’t just about sprints—it’s about validation loops, DoD enforcement, backlog hygiene, and TDD integration. We train you to design MVPs, run test coverage reports, and implement CI/CD pipelines that embed built-in quality with continuous delivery.
You’ll gain real-world skills in ensuring Agile output isn’t just fast—but reliable, stable, and feedback-ready.
Frequently Asked Questions
-
Quality Assurance (QA) is process-focused—it ensures that methods and systems are designed to prevent defects before they occur. QA includes audits, procedural standards, and continuous improvement frameworks like PDCA. In contrast, Quality Control (QC) is output-focused. It detects defects in deliverables using inspections, checklists, or statistical sampling. While QA builds quality into the process, QC verifies that the final product meets the agreed standards. Together, they form a loop: QA designs quality, and QC measures it. Most successful projects use both to create consistent, defect-free results that align with stakeholder expectations.
-
The Cost of Quality (CoQ) helps quantify how much a project spends on preventing defects versus dealing with failures. It includes prevention costs (e.g., training), appraisal costs (e.g., audits), internal failure costs (e.g., rework), and external failure costs (e.g., customer refunds). By analyzing CoQ, project managers can justify investing in proactive quality measures—because fixing defects after delivery is usually 10x more expensive. Understanding CoQ is essential for resource allocation, stakeholder reporting, and long-term profitability. It also helps demonstrate the ROI of Lean and Six Sigma practices in regulated or high-risk industries.
-
SIPOC diagrams help visualize the full lifecycle of a process—from suppliers to customers—before digging into technical workflows. By mapping out the five key elements (Suppliers, Inputs, Process, Outputs, Customers), project managers identify dependencies, quality risks, and scope boundaries early on. This tool is particularly useful during project initiation or when improving underperforming workflows. It also aligns stakeholders by giving everyone a shared process overview. SIPOC isn’t just a diagram—it’s a conversation starter that enables structured brainstorming, risk anticipation, and quality-by-design thinking from day one.
-
Control charts monitor performance metrics over time and reveal whether a process is statistically stable. They include a centerline (average), and upper/lower control limits that define acceptable variation. If data points stay within these limits, the process is considered “in control”—even if it's not perfect. Control charts are powerful because they prevent knee-jerk reactions to normal fluctuation, helping teams focus only on real quality threats. They also enable trend analysis, early detection of issues, and more effective root cause investigations. In Lean and Six Sigma, control charts are core tools for maintaining process integrity.
-
The Pareto Principle—often called the 80/20 rule—states that 80% of defects or problems usually stem from 20% of causes. In project quality management, this principle helps prioritize which issues to tackle first. Using Pareto charts, teams can quickly identify which root causes have the highest impact on defects, cost, or delivery time. By focusing on those few high-impact areas, PMs can deliver dramatic quality improvements with minimal effort. It's one of the most time-efficient techniques to reduce rework, boost reliability, and create value without burning resources on low-impact issues.
-
Kaizen promotes a culture of continuous, small-scale improvements, empowering every team member to spot inefficiencies and suggest fixes. Over time, this eliminates redundant steps and fosters proactive quality ownership. Poka-Yoke, or mistake-proofing, goes further by designing processes or tools that prevent errors entirely—like safety interlocks or input validations. These Lean tools focus not on reacting to problems, but on designing them out of the system. Together, they help create low-defect, high-efficiency workflows by combining cultural change (Kaizen) with process design (Poka-Yoke).
-
An error is a human mistake—like a miscalculation or a misunderstanding of requirements. A defect is the result of that error in a product or deliverable, such as a flawed report or failed test case. A bug is a specific kind of defect found in software systems, often related to faulty logic or code. While bugs are defects, not all defects are bugs. Understanding these distinctions is crucial for root cause analysis, escalation protocols, and audit readiness. Knowing where a failure originated helps teams prevent repeat issues and assign accountability effectively.
The Takeaway: Speak Quality with Confidence
Project success doesn’t start with deliverables—it starts with definitions. When you understand and apply quality management terminology with precision, you gain more than vocabulary—you gain strategic command over scope, timelines, and stakeholder satisfaction.
Every term in this guide—from AQL to SIPOC, from Jidoka to CoQ—represents a lever you can pull to prevent rework, justify resource allocation, or accelerate delivery without sacrificing standards. Most teams react to quality failures. The best teams design quality into every process stage.
As a project manager, your language defines your leadership. Speaking in metrics, limits, processes, and preventive frameworks allows you to lead with clarity, credibility, and control. It reduces miscommunication, avoids late-stage disasters, and turns quality into a shared team mindset—not a last-minute checkbox.
When quality becomes your native language, you don’t just manage projects—you elevate them.
Which Agile or Lean quality concept do you find most valuable in your projects?