
Complete Guide to Six Sigma Terms for Project Managers
Six Sigma is more than a quality tool—it’s a structured, data-driven approach to improving processes by minimizing variation and eliminating defects. For project managers, fluency in Six Sigma terms means you can better quantify risk, control outputs, and justify changes using real metrics—not just intuition. This gives you a strategic edge in cross-functional and regulated environments.
This guide breaks down the essential Six Sigma vocabulary every PM should know, including DMAIC, control charts, Cp/Cpk, and root cause techniques like 5 Whys and FMEA. But we go beyond textbook definitions. You’ll understand how each term plays a tactical role in planning, monitoring, and delivering project excellence. If you manage time, cost, scope—or all three—these terms are not optional; they’re foundational.

Six Sigma Core Concepts Every PM Should Know
Understanding Six Sigma starts with mastering the foundational concepts that guide every analysis, improvement, and implementation decision. These core ideas aren’t just theoretical—they’re practical tools that project managers use to diagnose inefficiencies, design better workflows, and measure progress with accuracy.
DMAIC, DMADV, DPMO
DMAIC (Define, Measure, Analyze, Improve, Control) is the backbone of Six Sigma for existing process improvement. Each phase has a tactical purpose:
Define outlines the problem and sets stakeholder expectations.
Measure gathers baseline data.
Analyze identifies root causes using statistical tools.
Improve tests and implements targeted solutions.
Control locks in gains through monitoring systems.
DMADV (Define, Measure, Analyze, Design, Verify) serves new process or product development, ensuring quality is built in from day one.
DPMO (Defects Per Million Opportunities) quantifies error rates with precision. If your DPMO is high, you're bleeding cost, trust, and time. A low DPMO signals that your process is predictable and robust—critical for regulated environments and high-stakes projects.
Sigma Level, Standard Deviation
Sigma level measures process performance. The higher the level, the fewer the defects:
A 6σ process = 3.4 defects per million opportunities.
A 3σ process = 66,807 defects per million.
Each sigma shift represents exponential quality improvement. Standard deviation, the statistical foundation of sigma levels, measures how spread out your data is from the mean. A smaller deviation means more consistency—key when quality equals compliance.
Project managers use this data to quantify stability, predict outcomes, and justify scope changes. You’re no longer guessing; you’re forecasting.
CTQs (Critical to Quality)
CTQs are the measurable, customer-defined attributes that determine success or failure. They translate vague expectations like “better service” into concrete specs like response time under 2 minutes.
Identifying CTQs ensures that you’re solving the right problem. For example:
In a clinical study: CTQ = “data entry error rate below 0.5%.”
In a SaaS project: CTQ = “load time under 3 seconds.”
Failing to define CTQs early means wasting cycles on solutions that miss the mark. For project managers, CTQs bridge customer expectations and technical deliverables—turning feedback into focused design.
| Concept | Definition / Function |
|---|---|
| DMAIC | A five-phase framework (Define, Measure, Analyze, Improve, Control) for improving existing processes by identifying root causes and implementing long-term fixes. |
| DMADV | A five-phase model (Define, Measure, Analyze, Design, Verify) for designing new processes/products with quality built in from the start. |
| DPMO | Defects Per Million Opportunities—a metric to quantify error rates. A low DPMO indicates a high-quality, stable process. |
| Sigma Level | Indicates process performance. A 6σ level equals 3.4 defects per million; the higher the sigma, the better the quality. |
| Standard Deviation | Statistical measure of variability. Smaller deviation = more consistency, which is vital for compliance-driven environments. |
| CTQs (Critical to Quality) | Customer-defined metrics that translate needs into measurable specs—key to ensuring stakeholder satisfaction and design alignment. |
Statistical Tools & Analysis Vocabulary
Project managers using Six Sigma don’t just guess where issues lie—they use statistical precision to spot bottlenecks, validate assumptions, and correct process flaws before they snowball. Below are the critical tools you’ll rely on to make data-backed decisions at every phase of a project lifecycle.
Normal Distribution, Process Capability (Cp, Cpk)
A normal distribution is a bell curve showing how your process data clusters around a mean. In project terms, if cycle times, budgets, or defect rates follow a normal curve, you're better positioned to anticipate delays or overruns.
Process Capability (Cp) measures how well a process can produce output within specified limits. Cpk, its more refined counterpart, adjusts for mean shifts—making it better for real-world variation.
Cp = (USL - LSL) / 6σ
Cpk = minimum of [(USL - μ)/3σ, (μ - LSL)/3σ]
High Cp and Cpk values mean your process consistently meets quality targets—crucial for industries like manufacturing, healthcare, or aerospace.
Hypothesis Testing, p-Value, Regression
Hypothesis testing lets you validate whether a change (like switching vendors or tools) actually improves performance—or if it’s just noise.
You define a null hypothesis (e.g., "new tool has no effect") and test it using a p-value:
p < 0.05? Reject the null. The change is statistically significant.
p > 0.05? Not enough evidence to say it helped.
Regression analysis uncovers the relationship between variables—for example, how defect rate correlates with employee training hours or cycle time. Use this to prioritize what matters, not just what’s visible.
ANOVA, Chi-Square, Control Charts
ANOVA (Analysis of Variance) tells you if multiple groups—say, three production lines—have different output quality. If the variance between groups is significantly higher than within groups, the process isn’t consistent.
Chi-Square tests compare observed vs. expected results for categorical data. Ideal for project audits or compliance reviews where data isn’t continuous.
Control charts visualize process stability over time. They plot data against upper and lower control limits:
If points fall outside limits or show patterns, your process is unstable.
If they stay within bounds, the process is under control.
Control charts let you detect process drift before it becomes a crisis—a critical advantage in long-duration or highly regulated projects.

Six Sigma Roles and Hierarchy
Six Sigma isn't just about tools—it's also about people. Project success depends on assigning the right responsibilities to clearly defined roles. Whether you’re leading a quality improvement initiative or embedding Six Sigma into a larger transformation, these roles create a scalable structure of ownership, skill, and accountability.
Yellow Belt, Green Belt, Black Belt, Master Black Belt
These “belt” designations signify levels of expertise and responsibility:
Yellow Belt: Basic knowledge. Supports projects by collecting data and assisting with tasks under supervision.
Green Belt: Intermediate. Leads small projects or supports Black Belts with analysis and implementation.
Black Belt: Advanced. Manages cross-functional improvement projects. Uses statistical tools, leads teams, and mentors Green Belts.
Master Black Belt: Expert. Oversees Six Sigma strategy, mentors Black Belts, and aligns projects with business goals.
Each level increases in scope, strategic thinking, and analytical depth. For project managers, Green or Black Belt training builds authority and credibility across technical and executive layers.
Project Sponsor, Process Owner
The Project Sponsor is the executive who funds and champions the project. They clear roadblocks and provide high-level direction. Without this role, Six Sigma projects often stall due to lack of visibility or priority.
The Process Owner is the person who manages the process on a day-to-day basis. They ensure changes are adopted and sustained. While the project manager executes, the process owner stewards results post-implementation.
For Six Sigma to deliver ROI, PMs must coordinate tightly with both—executing at the tactical level while aligning with strategic stakeholders.
Champions, Deployment Leader
Champions act as change agents. They’re senior leaders who identify Six Sigma projects, align them with organizational priorities, and secure resources.
Deployment Leaders are responsible for scaling Six Sigma across the organization. They create training plans, track progress across departments, and embed the methodology into company culture.
Together, these roles ensure Six Sigma isn’t just a buzzword—it’s a sustainable, organization-wide capability. For PMs, understanding this structure helps you escalate issues correctly, earn buy-in faster, and plug into larger enterprise quality goals.
| Belt Roles | Governance Roles | Leadership & Deployment Roles |
|---|---|---|
| Yellow & Green Belts: Entry to intermediate levels. Yellow Belts assist with data collection and simple tasks under supervision. Green Belts take on small projects or support Black Belts through analysis and hands-on implementation. | Project Sponsor: Executive leader who funds the project, clears roadblocks, and ensures strategic alignment and visibility. | Champion: Senior executive who selects and supports Six Sigma projects, secures resources, and drives alignment with business priorities. |
| Black & Master Black Belts: Advanced to expert. Black Belts lead major, cross-functional projects, use statistical tools, and mentor Green Belts. Master Black Belts oversee enterprise-wide Six Sigma strategy, mentor Black Belts, and ensure alignment with business objectives. | Process Owner: Manages the process day-to-day. Ensures implementation is adopted and sustained post-project. | Deployment Leader: Responsible for scaling Six Sigma across the organization through training, adoption metrics, and cultural integration. |
Defects, Variation & Root Cause Terms
At the heart of Six Sigma is the belief that every defect has a cause—and that variation isn’t random, it’s measurable and correctable. For project managers, these terms define how you identify what’s broken, quantify the damage, and correct it at the source instead of just treating symptoms.
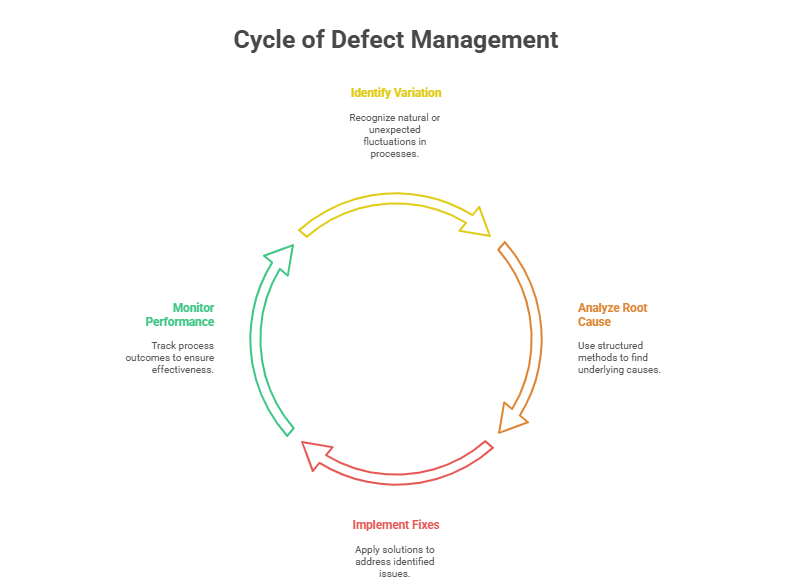
Special Cause vs. Common Cause Variation
Common cause variation is built into the system—it’s the natural fluctuation that occurs even when the process is stable. For example, slight delays in delivery due to varying traffic or minor temperature shifts in a lab.
Special cause variation is unusual, unexpected, and usually a sign of something broken. A machine failure, a staff member skipping a step, or an unexpected input—all are special causes.
Project managers must know when to:
Improve the process (common cause), or
Fix the outlier (special cause).
Misidentifying these can lead to overreacting to noise or ignoring real risks.
Root Cause Analysis (RCA), 5 Whys, FMEA
Root Cause Analysis (RCA) is the structured process of digging below symptoms to find the true reason for a failure.
One of the most practical tools? The 5 Whys:
Why did the shipment delay?
Because the label wasn’t printed.
Why wasn’t it printed?
Because the printer was offline.
Why was it offline?
Because maintenance was skipped.
You trace issues until they lead to a system flaw, not just a surface mistake.
Failure Modes and Effects Analysis (FMEA) maps out potential failure points in advance, scoring each one by severity, occurrence, and detection. It prioritizes Project risks before they happen—giving PMs the ability to proactively fix high-impact vulnerabilities.
Rolled Throughput Yield (RTY)
RTY measures how many units make it through multiple sequential steps without defects. While single-step yield shows immediate accuracy, RTY reveals cumulative process performance.
Formula:
RTY = Yield₁ × Yield₂ × ... × Yieldₙ
If each step is 95% accurate, and you have 4 steps:
RTY = 0.95⁴ = 81.45%
That means nearly 1 in 5 units fails by the end—even if each step looks fine in isolation.
For project managers, RTY highlights compounding defects across a workflow. It pushes teams to fix systemic inefficiencies, not just isolated errors.
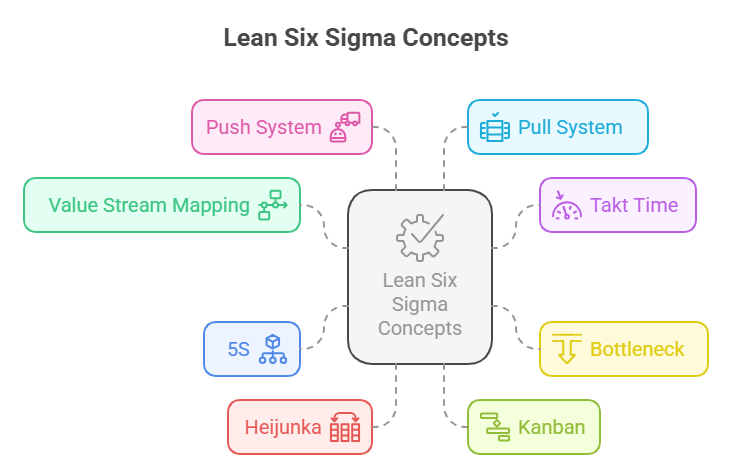
Lean Six Sigma Terminology
Lean principles eliminate waste. Six Sigma reduces variation. Together, Lean Six Sigma builds a process that’s fast, precise, and scalable. These terms help project managers identify flow problems, eliminate non-value activities, and improve delivery speed without sacrificing quality.
Value Stream Mapping, Takt Time, Bottleneck
Value Stream Mapping (VSM) is a visual tool that maps every step in a process—value-adding and non-value-adding. It reveals where time, effort, or cost is wasted.
Use VSM to:
Spot redundant handoffs
Measure actual vs. ideal flow
Identify delays between steps
Takt Time is the pace needed to meet customer demand.
Formula: Takt Time = Available Time / Customer Demand
If you're delivering slower than takt time, you're at risk of backlog. Faster? You might be overproducing and wasting resources.
A bottleneck is the slowest part of a workflow. It limits the entire process’s capacity. PMs must locate and elevate bottlenecks before scaling any operation.
5S, Heijunka, Kanban
5S organizes the workspace for efficiency and consistency:
Sort: Remove unnecessary items.
Set in order: Organize tools by usage.
Shine: Keep the area clean.
Standardize: Apply uniform procedures.
Sustain: Build habits and audits.
Heijunka levels production to avoid peaks and valleys in workload. Instead of batch processing, you spread tasks out to avoid burnout and reduce lead time variation.
Kanban is a visual scheduling system using cards or digital signals to manage work-in-progress (WIP). It controls flow, prevents overload, and boosts task transparency across teams.
Pull Systems vs. Push Systems
A push system produces based on forecast, regardless of actual demand—leading to inventory waste or idle time.
A pull system, by contrast, produces in response to real-time need. Each step pulls work from the previous one only when it's ready.
Lean favors pull systems because they:
Minimize overproduction
Balance workloads
Expose inefficiencies in real time
For PMs, implementing pull thinking means focusing on just-in-time planning, real-time visibility, and responsive project flow—especially in agile or iterative environments.
How Our Certification Teaches Six Sigma Application
The APMIC Advanced Project Management Certification doesn’t just mention Six Sigma—it embeds it. Through 500+ modules of structured training, you don’t just learn the terms—you apply them through live case simulations, quality improvement frameworks, and real-world implementation labs.
Lean, Six Sigma, and Quality Implementation Modules
Our curriculum integrates Lean Six Sigma training from the ground up:
DMAIC-based project templates that guide you through Define to Control phases
Live walkthroughs on how to perform root cause analysis and calculate Cp/Cpk
Deep dives into control charts, regression, and process stability metrics
You’ll build hands-on mastery through:
Simulated stakeholder sessions on setting CTQs
Case-based projects that require you to identify variation, prioritize risks with FMEA, and calculate yield across workflows
Every lesson ties directly into PMBOK-aligned practices. Whether you're managing Kanban-based software delivery, a compliance-heavy healthcare rollout, or a logistics optimization plan, Six Sigma tools become part of your execution toolkit—not just theory.
What sets the APMIC certification apart is its dual focus on operational excellence and project delivery. You’re not just passing a test. You’re learning to lead with metrics, make data-backed decisions, and instill quality systems that scale.
Frequently Asked Questions
-
Six Sigma focuses on reducing variation and defects through statistical analysis, using tools like DMAIC and control charts. Lean, on the other hand, centers on eliminating waste and improving flow. Lean Six Sigma combines both—boosting efficiency while ensuring consistency and quality. For project managers, this hybrid approach allows for faster delivery without sacrificing precision. Lean tackles delays and bottlenecks, while Six Sigma minimizes errors and improves predictability. Together, they give PMs full-spectrum process control across cost, quality, and time.
-
Not necessarily. While certifications like Green Belt or Black Belt add credibility, PMs can still apply Six Sigma principles without formal credentials. Knowing how to use tools like process mapping, Pareto charts, or hypothesis testing already enhances project performance. However, structured programs—like the APMIC Advanced Project Management Certification—embed these tools into real-world simulations, making it easier for PMs to drive change with confidence and measurable impact.
-
DMAIC is used for improving existing processes, while DMADV is for designing new processes or products. DMAIC aims to identify and eliminate root causes of variation, using iterative improvements. DMADV focuses on meeting customer specifications from the outset, emphasizing design quality and validation. PMs typically start with DMAIC when refining workflows but should use DMADV when building from scratch—especially in high-risk or innovation-heavy projects.
-
Cp and Cpk measure how well a process meets its limits. In practice, they show how consistently your outputs meet specs. For example, in a construction project, you can apply Cpk to evaluate the precision of concrete mix ratios. In healthcare, it might measure medication dosage consistency. A Cpk > 1.33 usually means the process is reliable. PMs use these metrics to determine whether processes need adjustment or if risks are within acceptable bounds before scaling operations.
-
Control charts track process performance over time using upper and lower control limits. If points stay within limits, the process is stable. If not, there’s special cause variation. PMs should use control charts in repetitive processes—like manufacturing, data entry, or customer onboarding—to monitor stability. Frequency depends on volume and risk: daily for high-risk workflows, weekly or monthly for lower-risk ones. Control charts give you a visual early warning system to detect issues before they become failures.
-
Failure Modes and Effects Analysis (FMEA) is a proactive tool that identifies where and how a process might fail—and prioritizes those risks. PMs use it during the planning phase to evaluate potential weak points in new systems, tools, or vendors. Each failure mode is scored on severity, occurrence, and detection. The output helps PMs focus on high-risk areas early, allocate resources smartly, and build risk response plans before problems happen. FMEA isn’t reactive—it’s a preemptive strike.
-
Start by translating stakeholder wants into quantifiable metrics. For example, if a client says, “We want faster onboarding,” a CTQ might be “onboarding time ≤ 48 hours.” Use tools like the VOC (Voice of the Customer), interviews, and process mapping to extract specifics. Always ask: “How will we measure success?” CTQs should be binary—pass/fail based on data. When done right, CTQs align stakeholder expectations with your execution plan, preventing scope creep and unmet goals.
Final Thoughts: Six Sigma Terms Demystified
Project managers don’t need to be statisticians—but they do need to speak the language of quality. The Six Sigma terms you’ve just reviewed aren’t just jargon—they’re precision tools that help you prevent rework, manage risk, and build scalable solutions.
From understanding variation to eliminating waste, mastering this vocabulary gives you tactical control over outcomes. Whether you’re reporting to a sponsor or coaching a team, these terms allow you to back every decision with measurable clarity.
Six Sigma doesn’t complicate project management. It sharpens it.