
Most project schedules fail before the deadline visibly slips. An approval is missing from the dependency network, two critical activities compete for the same specialist, or a task marked 90% complete has an unrealistic remaining-duration estimate. A critical path calculator exposes the sequence controlling delivery and calculates how much scheduling flexibility remains.
This guide explains the Critical Path Method (CPM) through a verified 11-activity example, a 30-point schedule diagnostic matrix, detailed float calculations, and practical techniques for evaluating delays, recovering lost time, and producing defensible project completion forecasts.
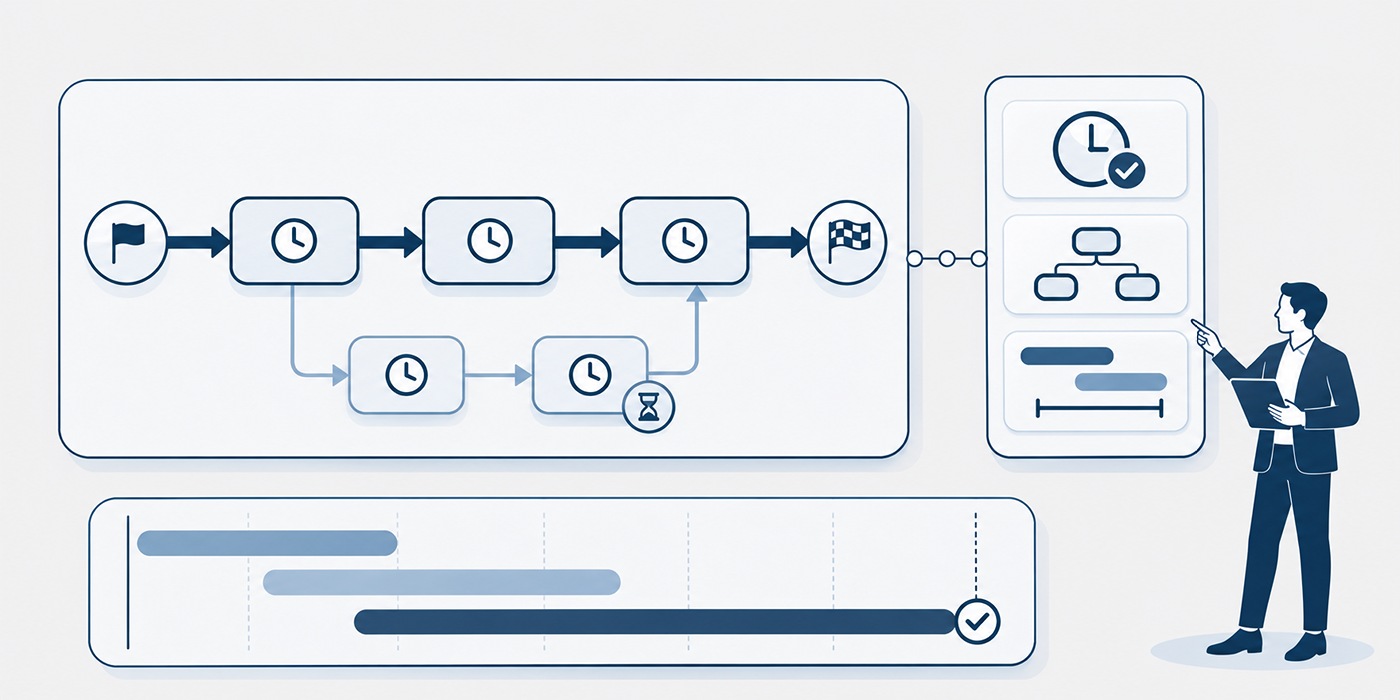
1. Critical Path Calculator: How CPM Determines Your Project's Earliest Finish Date
A critical path calculator analyzes activity durations and dependencies to identify the longest connected sequence of work governing project completion. Its principal output is the earliest finish date permitted by the modeled activity logic, assuming durations, calendars, and resource availability are realistic.
The calculation depends on three essential inputs: an activity's duration, its immediate predecessors, and the relationships connecting them. These inputs should come from a validated project schedule and work breakdown structure, with dependency ownership clarified through a RACI responsibility matrix. For complex programs, project governance practices provide the approval controls needed to prevent missing or unauthorized scope from distorting the schedule.
The four dates every CPM calculation must produce
Every activity requires four calculated scheduling values:
Early Start (ES): The earliest time an activity can begin after its predecessors satisfy their dependencies.
Early Finish (EF): The earliest time the activity can finish, considering its start and duration.
Late Start (LS): The latest time the activity can start without delaying the modeled project finish.
Late Finish (LF): The latest time the activity can finish without delaying the modeled project finish.
For a basic finish-to-start network with zero lag, one calendar, and time indexed from zero, the formulas are:
Forward pass:
ES = maximum EF of immediate predecessors
EF = ES + activity duration
Backward pass:
LF = minimum LS of immediate successors
LS = LF − activity duration
Float calculations:
Total Float = LS − ES = LF − EF
Free Float = minimum successor ES − EF
Activities without predecessors start at time zero. Terminal activities are evaluated against the project's calculated finish milestone. In this convention, finish times are exclusive, so a three-day activity starting at time zero finishes at time three.
These calculations support predictive project scheduling, while earned value metrics contribute a separate assessment of cost and progress performance.
Why the longest activity is rarely the whole scheduling problem
Consider three tasks requiring 12, 8, and 6 days. If all three can genuinely run in parallel, their combined section takes 12 days. If each depends on the preceding task, that section takes 26 days.
A calculator must evaluate the longest connected path through the complete activity network. Summing durations without checking predecessor logic overstates some schedules and understates others.
This becomes especially important when organizations use integrated project management software, where an incorrectly imported dependency can produce a convincing but inaccurate Gantt chart. Professionals transitioning from business analysis into project management should pay particular attention to approvals, testing prerequisites, and acceptance criteria that are often omitted from initial estimates.
What makes a CPM result trustworthy?
Before accepting the output, check for missing predecessors, circular relationships, disconnected activities, unexplained lags, incompatible working calendars, and artificial deadline constraints.
Also distinguish effort from elapsed duration. An activity estimated at 40 labor-hours could require five working days for one full-time employee, longer for someone shared across projects, or fewer elapsed days when genuinely divisible across multiple people.
A CPM network also assumes resources are available when the logic requires them unless resource constraints are explicitly modeled. That distinction matters in program management, where multiple initiatives share specialists, and in cybersecurity project delivery, where specialized reviewers may become bottlenecks.
An effective project executive should demand evidence that the network is complete, logically sound, and operationally achievable before accepting a calculated finish as a delivery commitment.
| CPM Element | What “Good” Looks Like | Schedule Impact | Signals / Tools | Who You Align With |
|---|---|---|---|---|
| 01. Activity ID | One unique, stable ID for each activity | Prevents broken dependencies | ID validation, schedule export | Scheduler, PMO |
| 02. Activity scope | Testable finish criterion for each task | Stops hidden unfinished work | WBS, acceptance record | Workstream owner |
| 03. Duration units | Elapsed working days, consistently defined | Prevents effort/date confusion | Calendar, estimate basis | Planner, resource lead |
| 04. Predecessor logic | Every prerequisite explicitly connected | Avoids premature starts | Logic trace, predecessor list | Technical lead |
| 05. Successor logic | Every activity leads toward acceptance | Avoids missing work at finish | Open-end audit | Scheduler, sponsor |
| 06. Finish-to-start | Real handoff before successor begins | Prevents artificial sequencing | FS dependency audit | Task owners |
| 07. Start-to-start | Valid concurrent start conditions | Makes overlap defensible | SS relationship review | Delivery leads |
| 08. Finish-to-finish | Successor completion tied to predecessor | Protects acceptance timing | FF milestone check | QA, business owner |
| 09. Start-to-finish | Rare relationship with clear rationale | Avoids unusual logic errors | SF exception review | Scheduler |
| 10. Lag | Documented waiting period and calendar | Exposes concealed idle time | Lag register | PM, vendor |
| 11. Lead | Evidence-based permitted overlap | Limits rework exposure | Lead approval | Technical, QA leads |
| 12. Work calendar | Correct shifts, holidays, workdays | Makes dates comparable | Activity calendar audit | PMO, HR |
| 13. Status date | One agreed reporting cut-off | Avoids stale calculations | Data date in schedule | PMO, team leads |
| 14. Early Start (ES) | Latest EF among predecessors for basic FS | Identifies actual earliest start | Forward pass | Scheduler |
| 15. Early Finish (EF) | ES plus modeled duration | Shows earliest task completion | Forward pass | Scheduler |
| 16. Late Finish (LF) | Earliest LS among successors for basic FS | Sets finish tolerance | Backward pass | Scheduler |
| 17. Late Start (LS) | LF minus task duration | Defines allowable latest start | Backward pass | Scheduler |
| 18. Total float | LS − ES, cross-checked with LF − EF | Quantifies finish-date margin | Total-float report | PM, workstream owner |
| 19. Free float | Earliest successor ES minus task EF | Protects next handoff | Free-float report | Successor owner |
| 20. Driving path | Connected activities governing completion | Shows where delay matters | Longest-path trace | PM, sponsor |
| 21. Parallel critical paths | All simultaneously driving chains visible | Prevents ineffective crashing | Multi-path review | PM, technical leads |
| 22. Near-critical path | Low-margin route tracked proactively | Flags emerging bottlenecks | Float threshold | Risk manager |
| 23. Negative float | Required date compared with feasible date | Quantifies recovery need | Constraint review | Sponsor, PM |
| 24. Date constraints | Contractual dates explicitly documented | Separates targets from feasibility | Constraint log | Sponsor, contracts |
| 25. Acceptance milestone | Formal completion includes sign-off | Prevents false finish claims | Acceptance checklist | Business owner, QA |
| 26. Logic loops | Directed network has no circular links | Keeps calculation solvable | Cycle detection | Scheduler, PMO |
| 27. Resource capacity | Named resources can cover concurrent tasks | Tests practical feasibility | Capacity / leveling check | Functional managers |
| 28. Baseline control | Original commitment and current forecast kept | Shows true variance | Baseline comparison | PMO, sponsor |
| 29. Remaining duration | Work left estimated from current evidence | Improves live forecasts | Status/estimate review | Task owner |
| 30. Risk and recovery | Uncertainty and compression scenarios tested | Supports defensible deadlines | Scenario analysis | Risk lead, sponsor |
2. Worked Critical Path Calculator Example: Calculate CPM and Project Duration Step by Step
The best way to understand a CPM calculator is to reconstruct its output manually. Consider a software implementation with 11 activities, three dependency merges, an external supplier, a testing stage, and formal acceptance.
All activities use finish-to-start relationships, zero lag, one working calendar, and durations measured in working-day units. This keeps the calculation independently verifiable before adding the complexity of integrated scheduling tools, resource allocation decisions, or risk-adjusted scheduling.
Step 1: Define the activities and dependencies
The network begins with A: Requirements approval, lasting 3 days. From A, two streams begin.
The development stream is B: Architecture, lasting 4 days after A, followed by D: Development, lasting 7 days after B.
The supplier stream is C: Procurement, lasting 6 days after A, followed by E: Vendor configuration, lasting 3 days after C.
These streams join at F: Integration, lasting 4 days and requiring both D and E to finish.
Separately, G: Test preparation lasts 5 days after B. H: System testing lasts 5 days and requires both F and G.
After H, I: Deployment requires 2 days. Meanwhile, J: User training lasts 4 days after E. Finally, K: Acceptance takes 1 day and requires both I and J.
This network models a realistic distinction between technical completion and organizational readiness. A system may be deployed while training remains unfinished, or training may finish while development still blocks release. Project governance specialists should define acceptance criteria explicitly, while RACI-based responsibility assignments ensure that supplier, technical, and business handoffs have accountable owners.
Step 2: Calculate the forward pass
Begin at time zero.
A runs from day 0 to day 3. B and C both start on day 3, finishing on days 7 and 9, respectively.
D starts on day 7 and finishes on day 14. E starts on day 9 and finishes on day 12.
Integration F must wait for both D and E. Its early start is therefore max(14, 12) = 14, and its early finish is day 18.
G runs from day 7 to day 12. H waits for F and G, so its early start is max(18, 12) = 18 and its early finish is day 23.
I finishes on day 25. J finishes on day 16. K waits for both, starts on day 25, and finishes on day 26.
The forward pass establishes the logic-feasible project duration. It also identifies meaningful bottlenecks: integration waits for development, testing waits for integration, and acceptance waits for deployment.
For technology project managers, these merge points are often where incomplete interface specifications become expensive delays. A well-maintained project management template should preserve every predecessor, while predictive scheduling techniques can highlight branches approaching their available float limit.
Step 3: Calculate the backward pass
Start at K's finish of day 26. K's latest start is day 25.
Since both I and J must finish before K, their latest finishes are day 25. I lasts 2 days, so its latest start is day 23. J lasts 4 days, giving it a latest start of day 21.
H must finish by day 23 and therefore start by day 18. F must finish by day 18 and start by day 14.
D must finish by day 14, producing a latest start of day 7. E also must finish by day 14 to support F. Although E finishes as early as day 12, it can finish as late as day 14.
Because E lasts 3 days, its latest start is day 11. C must consequently finish by day 11 and can start as late as day 5.
G must finish by day 18, giving it a latest start of day 13. B has two successors, D and G. Its latest finish is the earlier of their latest starts: min(7, 13) = 7.
The backward pass completes the early and late dates needed to calculate float. PM consultants conducting schedule reviews should check calculations at every branching point, while program managers coordinating shared suppliers should verify that the apparent flexibility survives capacity conflicts.
Step 4: Identify the critical path and total project duration
The connected path with zero total float is:
A → B → D → F → H → I → K
Its duration is:
3 + 4 + 7 + 4 + 5 + 2 + 1 = 26 days
This is the project's critical path, and 26 days is its calculated minimum duration under the stated assumptions.
The supplier route A → C → E → F → H → I → K totals 24 days. The difference between that route and the critical path is two days.
The test-preparation route through A, B, G, H, I, and K totals 20 days. It finishes its prerequisite work six days before testing needs it.
These calculations immediately tell management where to focus. Earned value reports can identify progress or cost deviations, but the dependency network determines how individual delays affect completion. Executive project reporting should therefore distinguish critical-path exposure from overall task completion percentages.
3. Calculate Total Float, Free Float, and Near-Critical Paths Without Misreading Schedule Flexibility
The distinction between total float and free float is central to using a CPM calculator correctly. Both measure scheduling flexibility, but they protect different things.
Total float is the time an activity can slip before affecting the calculated project finish, assuming the surrounding network remains unchanged.
Free float is the time an activity can slip without delaying the earliest start of any immediate successor.
The difference becomes especially important when multiple activities share the same branch. In multi-project resource planning, teams may incorrectly treat available float as spare capacity. Effective schedule governance requires the float to be interpreted in the context of dependencies, and forecasting tools should show how float changes as activities progress.
Why procurement has two days of total float but zero free float
In the worked example, procurement activity C has:
ES = 3, EF = 9, LS = 5, LF = 11
Its total float is 5 − 3 = 2 days.
However, its successor E starts on day 9, exactly when C finishes. Therefore, C's free float is 9 − 9 = 0 days.
A one-day procurement delay shifts vendor configuration one day later. The overall project can still finish on day 26 because the supplier branch has unused margin before integration.
This distinction helps project coordinators understand why an activity may remain noncritical while disrupting another team's planned start. When coupled with clear responsibility assignments, it also identifies who must be informed when a delay consumes shared scheduling flexibility.
Why consecutive activity floats cannot simply be added
C and E each have two days of total float. Their combined branch has two days of margin, rather than four.
Suppose C takes eight days instead of six. E starts on day 11 and finishes on day 14. Integration can still begin on day 14, but the supplier branch has exhausted its original float.
If E then takes one additional day, integration moves to day 15 and the project completion moves to day 27.
Treating both activities' original float values as independent allowances would conceal this exposure. Senior PM consultants should inspect shared branch margins during schedule audits, while executive reporting practices should distinguish the number of activities with float from the actual amount of protection remaining.
What happens when procurement is delayed by three days?
Increase C from six to nine days.
C now finishes on day 12. E consequently finishes on day 15, causing F to start on day 15 rather than day 14.
H moves from day 18 to day 19, I moves from day 23 to day 24, and K finishes on day 27.
The three-day procurement overrun consumes two days of existing branch margin and causes one day of project delay.
This is why earned value schedule indicators need to be interpreted alongside actual dependency calculations. A project can remain broadly on budget while a relatively small procurement issue threatens its promised delivery. Predictive schedule analysis should prioritize changes to the projected finish over activity-delay counts alone.
Negative float and near-critical paths
Negative total float commonly appears when an imposed deadline is earlier than the calculated feasible completion.
If the network requires 26 days but management imposes a day-24 completion constraint, scheduling software may show −2 days of float on the driving path. That exposes a two-day recovery requirement.
The decision is to change the work plan, add feasible acceleration, renegotiate the date, or accept an explicitly documented schedule variance. Project governance leadership should protect the integrity of the original calculation, and project executives should see both the required date and the logic-driven forecast.
Near-critical paths deserve comparable attention. A branch with two days of float may become critical after a minor delay. For the example project, an operational threshold of two days would flag the procurement route for closer monitoring.
The appropriate threshold depends on schedule length, uncertainty, contractual exposure, and the frequency of progress updates. Risk-aware forecasting, project management governance, and standardized reporting templates can help turn this information into consistent escalation rules.
Choose the scheduling problem that causes the most delays in your projects and click Submit for personalized CPM guidance.
Submit
Choose your biggest scheduling challenge above to receive a targeted recommendation.
Audit predecessor and successor links, remove false logic, and check all merge points. Recalculate the forward and backward pass after correcting the network.
Identify shared specialists and overloaded resources, then level or reassign work before recalculating the finish and driving path.
Map supplier dates to downstream activities, compare delays against available float, and test expedited procurement or alternate sourcing.
Require every change to show affected activities, duration impact, and revised completion date before approval.
Compare the required finish with the earliest feasible finish, then test crashing and fast-tracking on the real driving activities.
Recheck ES, EF, LS, and LF values, then verify total float and free float carefully, especially on shared branches and near-critical paths.
4. How to Use a Critical Path Calculator for Accurate Project Scheduling and Weekly Control
A CPM calculation becomes operationally valuable when its outputs are connected to real progress, resource availability, decision ownership, and a controlled schedule baseline.
A reliable implementation should answer four questions at every reporting cycle: What is the earliest achievable completion? Which activities currently control that date? Which alternative paths could become critical? What intervention offers the greatest measurable reduction in schedule exposure?
The following workflow turns those answers into decisions.
Establish a complete and auditable activity network
Every activity should have a stable identifier, a measurable completion condition, a duration, predecessor relationships, an assigned calendar, and an accountable owner.
Include regulatory approvals, procurement lead times, independent quality checks, integration testing, and final acceptance wherever they genuinely constrain delivery. These activities frequently disappear from optimistic initial schedules because their effort is small relative to development or construction.
For example, a one-day security authorization can hold up a six-month system implementation. The authorization's short duration does nothing to reduce its criticality.
This is especially important for cybersecurity project management, international development programs, and project governance leadership, where external approvals may determine whether a deliverable can legally or operationally be accepted.
Protect the baseline while updating the forecast
The baseline records the approved delivery commitment. The current schedule reflects what is achievable using the latest actual progress and remaining-duration estimates.
Maintain these separately. When the forecast moves from day 26 to day 27, overwriting the baseline destroys evidence of the variance and makes future accountability harder.
Record the date of each status update, actual starts and finishes, revised remaining durations, approved scope changes, and material dependency changes. Project management software integrations can automate part of this collection, while standardized project templates preserve a consistent change history.
For in-progress work, ask owners to estimate the work remaining, rather than deriving it mechanically from the reported percentage complete. An activity marked 80% complete may still contain the most technically uncertain 20%.
This distinction is particularly relevant when evaluating AI-supported project reporting and interpreting earned value management calculations.
Test resource feasibility before approving a completion date
Traditional CPM calculations generally assume required resources are available. This can produce an unrealistic forecast when several activities need the same engineer, inspector, equipment operator, or approval authority at the same time.
Suppose B and C are scheduled concurrently but require a specialist who can only complete one assignment at a time. The original parallel arrangement may be impossible.
Evaluate resource capacity, alternative staffing, activity priority, and permissible sequencing. Recalculate the schedule after the allocation decision. Resource leveling may change the finish date and the driving path.
Professionals moving from operations management into project management already understand many capacity constraints; program managers must extend that analysis across multiple projects.
Monitor changes in the critical path, not merely delays
Criticality can move between branches as work progresses.
A supplier activity with two days of float may become critical after a modest overrun. Meanwhile, an originally critical development task may finish early and cease to control completion.
During each update, compare the current critical path, its duration, the lowest-float alternative paths, and the activities that have consumed float since the previous reporting cycle.
This approach improves predictive project monitoring and gives executive stakeholders a clearer explanation of why the completion forecast changed.
A useful escalation threshold might require immediate review when a near-critical branch has two working days of float remaining and contains a supplier delivery whose uncertainty exceeds that margin.
Convert the calculation into a decision request
A weak status update says, "Procurement is behind schedule."
A decision-ready update says, "Procurement is forecast to finish on day 12, three days later than originally planned. This moves integration to day 15 and go-live acceptance to day 27. The procurement owner must evaluate an expedited delivery option and its cost before the next steering decision."
That statement quantifies the delay, identifies its propagation through dependencies, and establishes the action required.
Connect these decisions to a RACI ownership structure, formal project governance procedures, and relevant earned value performance indicators.
The goal is to make the critical path calculator a decision-support mechanism that shows what intervention can change the completion date, what it costs, and who has authority to approve it.

5. How to Shorten the Critical Path: Crashing, Fast-Tracking, and Risk-Based Forecasting
Once the critical path is known, managers can evaluate whether the completion date can be improved through shorter activity durations, adjusted dependencies, alternative resources, or scope decisions.
The important constraint is that an activity-level improvement creates a project-level benefit only when it changes the longest controlling path.
Crashing: reduce the duration of a driving activity
Crashing accelerates work by applying additional resources, paying for expedited services, or changing execution methods while preserving required deliverables.
Return to the 26-day example.
Suppose development activity D can be shortened from seven days to five days through technically feasible additional staffing.
D now finishes on day 12 rather than day 14. Vendor configuration E also finishes on day 12.
Integration F can begin on day 12, system testing H begins on day 16, deployment I finishes on day 23, and acceptance K finishes on day 24.
The project gains two days.
However, an important complication emerges: both the development path and procurement path now reach integration at day 12.
There are now two controlling paths.
Additional acceleration of D alone would produce no further reduction in the project's finish while E remains unchanged. A second compression decision must address both driving branches or select an activity common to them.
This is where project cost forecasting, strategic project governance, and scenario-based scheduling become essential.
Calculate whether crashing is economically justified
The basic crashing cost slope is:
Crash cost per day = (Crash cost − Normal cost) ÷ (Normal duration − Crash duration)
Suppose reducing D from seven days to five requires an additional $8,000. The incremental acceleration cost is $4,000 per day.
If the resulting two-day project improvement avoids a credible $12,000 contractual penalty, the acceleration may create a $4,000 net benefit before considering other impacts.
The analysis should also include additional quality risk, overtime fatigue, coordination overhead, supplier premiums, and the possibility that other branches become critical.
Experienced senior project management consultants should examine the marginal cost of each successive day saved. Project executives should approve acceleration based on measurable business consequences rather than pressure to produce a more attractive finish date.
Fast-tracking: overlap activities that were previously sequential
Fast-tracking changes the planned order or overlap of work.
For example, testing preparation could begin before the entire development package is complete, provided early deliverables are sufficiently stable. Supplier onboarding may overlap parts of the procurement process where policy and contractual conditions permit.
The calculation must represent the revised relationship accurately. A legitimate start-to-start link or controlled partial handoff should replace an unsuitable finish-to-start relationship.
The primary risk is rework. If early work changes, the accelerated successor may need to repeat completed activities.
This trade-off is familiar to teams transitioning from traditional to Agile project management and professionals following an Agile project manager career pathway.
Fast-tracking is especially sensitive where procurement law, contractual acceptance, safety inspections, or cybersecurity assurance requirements prohibit premature progression.
Add uncertainty analysis before treating the finish date as a promise
CPM produces a deterministic result from the durations and relationships entered into the network. Actual activities may take longer or shorter than expected.
Three-point estimating can represent activity uncertainty using optimistic (O), most likely (M), and pessimistic (P) durations. The traditional PERT weighted estimate is:
Expected duration = (O + 4M + P) ÷ 6
That formula provides an estimate under specific distribution assumptions. It does not independently establish a reliable completion probability.
For more sophisticated analysis, Monte Carlo scheduling samples uncertain durations repeatedly and recalculates project completion, allowing different paths to become critical across simulations.
Model correlated risks carefully. A supplier disruption may simultaneously affect procurement, vendor configuration, and integration readiness. Treating those impacts as completely independent can distort simulated delivery probabilities.
Predictive analytics in project management can support these models, while project management cybersecurity planning illustrates why correlated technical and compliance risks deserve special consideration.
For high-consequence delivery commitments, present three distinct results: the logic-only earliest finish, the resource-feasible forecast, and a risk-adjusted completion range. Together with earned value forecasting and consistent governance reporting, those results offer management a more defensible basis for scheduling decisions.
6. FAQs: Critical Path Calculator, CPM Formulas, Float, and Project Duration
-
Begin by listing every activity, its duration, and its immediate predecessors. Calculate the earliest start and finish using a forward pass, then calculate the latest start and finish using a backward pass.
Subtract early start from late start to determine total float. In a simple unconstrained network, trace the connected activities with zero total float from project start to completion.
For the example in this guide, A → B → D → F → H → I → K is the 26-day critical path. Use a consistent project schedule template and validate ownership with a RACI matrix generator.
-
The critical path represents the longest connected sequence of dependent activities governing project completion. The longest individual activity is simply the task with the greatest duration.
A 15-day activity running in parallel with a 25-day sequence may have significant float. Meanwhile, five consecutive five-day activities can jointly form the critical path.
A reliable project management scheduling system calculates connected paths rather than ranking tasks by duration. This distinction is particularly important for professionals transitioning into project management who may initially prioritize work based on task size.
-
Yes. Multiple paths become critical when they independently control the same earliest project completion.
In the worked example, shortening development D from seven days to five causes the development and procurement branches to reach integration simultaneously. Both branches then control the start of integration.
Additional acceleration must consider every driving branch. Compressing only one may leave the project finish unchanged.
This makes program-level dependency management essential when multiple suppliers or delivery teams converge on a shared milestone. Predictive scheduling tools should also identify near-critical alternatives that may become controlling after schedule changes.
-
For a basic finish-to-start network, total float equals LS − ES, while free float equals minimum successor ES − EF.
Consider procurement C, which finishes on day 9 and has a latest finish of day 11. Its total float is two days.
However, its immediate successor E begins on day 9, so C has zero free float. Delaying C immediately changes E's earliest start, even though the project completion remains protected initially.
Project governance frameworks should distinguish these measures, particularly where responsibility assignments involve commitments between independent teams.
-
Negative float usually indicates that a required scheduling constraint cannot be met by the current activity network.
For example, a project requiring 26 days to complete may show negative two days of float when constrained to finish by day 24.
That creates a measurable recovery requirement. Managers must identify feasible acceleration, revise scope through approved change control, adjust resource allocation, or negotiate the deadline.
The project executive decision process should make the conflict explicit, while earned value forecasting helps assess the financial implications of a recovery plan.
-
Yes. Different working calendars can change when activities start and finish, alter their available float, and sometimes change which sequence controls project completion.
A five-working-day activity scheduled across a weekend may span seven calendar days. Different shift patterns, regional holidays, supplier working hours, and restricted inspection windows create further variation.
For accurate results, apply the appropriate calendar to each activity and verify how the scheduling software interprets relationships across different calendars.
This is especially relevant for international project management, global delivery teams, and organizations using integrated scheduling platforms.
